Download
1 / 65
650 likes | 743 Views
Leadership: Preparing the System for Transformative Change. Elizabeth A. Clark, Ed.D. David Holland. 2012 Assessment and Graduation Data. 2013 State Accountability Proposals. Nov 30 TEA document Feb 21 Communication Feb 28 TEA document. 2012 State Accountability Guesstimates.

E N D
Leadership: Preparing the System for Transformative Change Elizabeth A. Clark, Ed.D. David Holland
2012 Assessment and Graduation Data 2013 State Accountability Proposals Nov 30 TEA document Feb 21 Communication Feb 28 TEA document 2012 State Accountability Guesstimates
Considerations • Best guesstimates based on limitations of data, accountability information, mental capacities • Benefits to the analysis • Better understand the intricacies of the new accountability system • Help predict where campuses and the district may land in 2013 • Allow for between-campus comparisons
2013 is a transition year • Four indices • Index 1 – Student Performance • Available for all campuses and district in 2013 • Index 2 – Student Progress • Available in 2013 (but not calculated for the 2012 data) • Index 3 – Closing Performance Gaps • Available for Level II performance only in 2013 • Index 4 – Postsecondary Readiness • Advanced performance not available in 2013 • Graduation measures available for district and HS only
Handouts • Calculation parameters • Index calculations • Based on 2012 data • Assessment data from TAKS (grades 10 & 11), STAAR and EOC • Graduation data from 2012 AEIS • Index point range 0-100 • Two possible campus and district ratings in 2013 • Met Standard • Improvement Needed
Index 1 – Student Performance • Overall percentage meeting STAAR Phase 1 Level II standard or TAKS Recommended standard • Inclusions • All tests (M and Alt without cap) • All students • TAKS grade 10 and 11 • ELLs with 4 or more years in US schools • October snapshot accountability subset
Index 1 – Student Performance 37563 / 47215 = .796 Page 1
Index 3 – Closing Performance Gaps • Same tests and performance standards as Index 1, but TAKS not included for HS • Snapshot subset, ELLs 4 or more years • Student groups evaluated • Economically disadvantaged • Lowest performing race/ethnicity subgroup in previous year (based on 2011 AEIS) • Second-lowest performing race/ethnicity subgroup in previous year • Minimum group size: 20 students (25 in 2/28/13 proposal)
Index 3 – Closing Performance Gaps Race/Ethnicity subgroup size and performance Economically disadvantaged Page 2
Index 3 – Closing Performance Gaps Hispanic Pacific Islander Reading Performance - 2011 AEIS Page 2
Index 3 – Closing Performance Gaps + + = Sum of all groups 3 groups = 300 possible pts • If only 2 race/ethnicity subgroups meet minimum size, then 1 group is evaluated. • If only 1 race/ethnicity subgroup meets minimum size, then no groups are evaluated. Page 2
Index 3 – Closing Performance Gaps + + + + = 1044 / 1500 = .696 = 70% Page 6
Index 4 – Postsecondary Readiness • Advanced Performance (not used in 2013) • Index 1 assessments • Snapshot subset, ELLs 4 or more years • Standard: Level II at Recommended (2016) • Student groups • All students • 7 race/ethnicities • Minimum size: 20 (25 in 2/28/13 proposal) • Numerator: Number of students meeting standard on one or more tests
Index 4 – Postsecondary Readiness Advanced Performance measure not available in 2013 Page 8
Index 4 – Postsecondary Readiness • Graduation-Related Measures • 4-year or 5-year graduation rate (use whichever one results in the highest index score) • Percentage of graduates with RHSP/DAP diplomas
Index 4 – Postsecondary Readiness + Index 4 score for District and High Schools Page 9
Rating summary Districts and campuses must meet the target in at least one index to achieve a rating of Met Standard Page 10
Rating Summary • The good news • Based on these estimates, the district and all campuses achieved a Met Standard rating • Caveats • All accountability measures are subject to change • All 4 indices will be fully implemented in 2014 • Phase 2 standards will be in place in 2014 • Counting ELLs with 2 or more years in US schools proposed for 2014 • TAKS grade 11 only in 2013, no TAKS in 2014
Longitudinal thinking Eng III Eng II Eng I 2016 How will we ensure that our current 6th graders are well prepared for success at the next level? 8th 2015 7th 2014 6th 2013 SSI in 2016 5th Level II Phase-in 4th 3rd 2nd 2016 & beyond 1st How do we determine whether our kindergarten through grade 2 students are well prepared for success at the next level? 2014 & 2015 Final Kinder Phase 2 2012 & 2013 Phase 1
Transformation Model WRITTEN TAUGHT TESTED
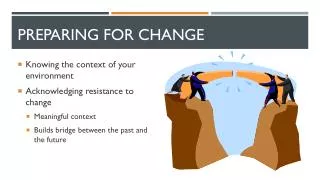
Why Change? • What problems or areas of concern necessitate our need for change? What evidence or data supports your observations? • Complete the first two columns of the graphic organizer, then share with your table and be prepared to share with the larger group.
District Initiatives • As you think about the areas of concern/problems, what new initiatives come to mind that have been implemented this year. How do these initiatives relate to the problems/concerns? • Continue to discuss with your table and add to your graphic organizer.
District Response to Initiatives • What observations or evidence do you have that indicate progress is being made toward addressing the problem of academic performance? • Continue to discuss with your table and add to your graphic organizer.
Situation… How can strong cultures impede change? With an elbow partner, discuss this and be prepared to share your thinking.
Our Response in order to equip every child with the best education possible.
Innovation • The degree of innovativeness in an organization is based on how much organizations are (and allow members to be) inventive, diverse, creative, and risk-takers. • High innovativeness without adequate Goal Focus does not necessarily produce improved results. • Innovation demands proactivechange rather than reactivechange. OHDDC
Adaptation • The ability to tolerate stress and maintain stability while coping with demands of the environment. This implies that the organization does not control the external impetus for change, but it can control the process for that change. • The implication is that leaders who want to have an adaptive and responsive organization need to be in a position to facilitate the change process in order to “tolerate stress” and “maintain stability.” OHDDC
Goal Focus • The ability of persons, groups, or organizations to have clarity, acceptance, support, internalization, and advocacy of goals and objectives. Implicit within this definition is the realization that organizational members may have varying levels of Goal Focus individually and that individuals may have varying levels of Goal Focus for specific goals. • The level of Goal Focus is a measure of commitment to the “what” of organizational purposes. OHDDC
Goal Focus Advocacy Internalization Support Acceptance Clarity Sequential Steps for Improving Goal Focus Building Capacity
Activity • Based on what you have heard about Innovation, Adaptation, and Goal Focus, what implications does this have for: • You as a campus leader? • The district as a whole? • Members of your staff? • Discuss this at your table and be prepared to share with the larger group.
Preparing a System… • Low-achieving schools need “tightly controlled teaching and learning processes from the center because minimizing variation across classrooms and schools is the core driver of performance improvement at this level.” - Porter-Magee, 2010 McKinsey Study of 20 successful School Systems
Positive Culture Purkey & Smith Snyder & Snyder “An academically effective school is distinguished by its culture: • Structure • Process • Climate of values & norms • Focus on successful teaching and learning” “Changing culture through a systems thinking approach is based on: • Organizational planning • Developing staff • Developing a program • Assessing school productivity”
System Alignment is achieved by: • Increasing people’s understanding and acceptance of the new mission, goals, and initiatives • Increasing the knowledge and skill level to do the work • Building on successful past experiences • Providing accountability through increased competency and the willingness of individuals to commit and advocate for the system goals/initiatives
Factors to Consider in Exercising Leadership High Relationships/Behaviors Effectiveness Dimension Low Initiating Structures/Tasks Low High
Is the 2D Model always true? • People operate at varying levels of readiness depending on the situation • Situational leadership is necessary in order to align to the needs/readiness levels of the “followship” in any given situation
Personal Alignment Requires: • Facilitation by the leader to grow and develop people from dependent to interdependent by building shared commitment to mission, vision, and values. • As trust is gained, synergistic results are achieved and the collective “we” moves closer to advocacy levels. • Leaders must have style flexibility to match variety of situations.
High Situational Leadership Participating Selling Relationship Behavior (Supportive Behavior) Delegating Telling Low Task Behavior Low High (Directive Behavior)
High Participating Selling Situational Leadership Explain decisions and provide opportunity for clarification Share ideas and facilitate in decision making Relationship Behavior (Supportive Behavior) Delegating Telling Turn over responsibility for decisions and implementation Provide specific instructions and closely supervise performance Low Task Behavior Low High (Directive Behavior)
Style Flexibility Chart Based on Readiness Levels of Followers
Style Flexibility Chart Based on Readiness Levels of Followers
How do you know when to TELL, SELL, PARTICIPATE, and DELEGATE? • It depends on the degree to which the individual has the knowledge and skills to accomplish the specific task. (Are they ABLE?) • It also depends upon the degree to which the individual is WILLING or MOTIVATED to accomplish the task. (Are they willing?)
High Leader: Participating Leader: Selling Situational Leadership Follower: R3 Follower: R2 Explain decisions and provide opportunity for clarification to those UNABLE, but WILLING/ MOTIVATED Share ideas and facilitate in decision making for those ABLE, but UNWILLING/INSECURE Relationship Behavior (Supportive Behavior) Leader: Delegating Leader: Telling Follower: R1 Follower: R4 Provide specific instructions and closely supervise performance of those UNABLE and UNWILLING/INSECURE Turn over responsibility for decisions and implementation to those ABLE and WILLING/MOTIVATED Low Task Behavior Low High (Directive Behavior)
Salient Points • Leadership is the key to organizational effectiveness (i.e. Organizational Health) and must permeate the district. • People range on a continuum of readiness from R1 to R4 depending upon the initiative/situation. • Leadership is situational. • Leaders must be able to diagnose accurately in order to know how to respond appropriately to the readiness levels of staff relative to a particular situation. • Most effective leaders have great diagnostic skills and adjust leadership styles based upon their diagnosis.
Goal Focus Advocacy Internalization Support Acceptance Clarity Sequential Steps for Improving Goal Focus Building Capacity
How do you change people’s behavior? • Change the behavior of the leader (style flexibility). • Change the followers’ behavior. • Change structures and processes. • Tell the reason “why”
Clues for Identifying Levels of Goal Focus Unclear (Below the level of Clarity) • “I have difficulty in seeing….” • “I don’t really understand why…” • “I don’t understand how…” • “It is unclear…” • “I wish they would make up their minds and just tell us what to do.” R1