Download
1 / 12
120 likes | 201 Views
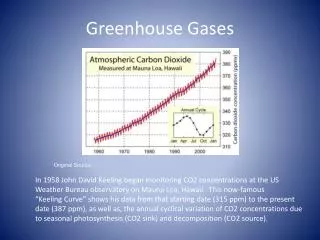
Signals of Photosynthesis and Respiration at Boreal Forests Response to Environment Changes: Retrieved from Isotope Measurements of Atmospheric CO 2

E N D
Signals of Photosynthesis and Respirationat Boreal ForestsResponse to Environment Changes:Retrieved from Isotope Measurements of Atmospheric CO2 Lin Huang1, Baozhang Chen2, Pieter Tans3, Kaz Higuchi1, Doug Worthy1 Jing Chen2, A. Shashkov1, D. Ernst1, A. Chivulescu1, and M. Ernst1 1: Meteorological Service of Canada, Environment Canada, Canada 2: University of Toronto, Canada 3: Climate Monitoring & Diagnostics Laboratory/NOAA, USA
Intensive campaigns(1998-2000) • Weekly diurnal flask pair(2003- present) Existing sites Possible sites planned for IPY (integrated measurements of GHGs and CO2 isotopeswith CO2 flux) # Starting year for vertical profile by CMDL/NOAA Canadian Greenhouse Gases Measurements Network (MSC) & Ecosystem -zones Alert (GAW) 6 Churchill 3 Estevan Point 5 Prince Albert Sable Island Fraserdale Borden
MBL data at the corresponding latitude CO2 and d13C Measurements at Fraserdale (~ 50N) [MBL data from CMDL/NOAA cooperative air sampling network, analyzed by CMDL & INSTAAR]
Ma*dCAir= FSR+ FPR – FPh =FER -FPh Ma*CAir*[dd13CAir]= FEr*(d13CER – d13CAir) -FPh*Dph-air Atmospheric CO2 Plants CO2 Tower(40m) 20m Soil CO2 2L Auto-sampler Variations of Air CO2 & d13CAir in Terrestrial Ecosystem (on regional scale) * If biomass burning and fossil fuel combustion can be ignored.
Questions & Challenges Can we measure photosynthesis discrimination (of 13C) on a regional scale? Can we retrieve the signals of regional Ecosystem Respiration and Photosynthesis Discrimination from atmospheric measurements? What are the responses of these signals to environment changes (e.g. T and VPD)? Are there any relationship between these responses and the variation of CO2 fluxes?
(using MBL data as an approximation) Free troposphere Two – Ends Member Mixing Two - end Members Mixing * biomass burning and fossil fuel combustion are ignored. d13Cob*Cob = d13CEco* Cob+ Cbg*(d13Cbg-d13CEco) Photosynthetic CO2 Daytime:Intercept =Cbg*DEco Nighttime:Slope =d13CER Net Eco Component PBL height Plant respired CO2 ΔEco = [13Cbg – 13CEco] Soil CO2 d13CEco= [d13CER *FER + FPh *CPh]/[FER+FPh] 2L Auto-sampler
Seasonal Variation of Ecosystem Respiration (Fraserdale, ~ 50N) 13CER = 0.068 T 27.12 ( 0.26) with P < 0.01
Seasonal Variation of Ecosystem Discrimination (Fraserdale, ~ 50N) DEco = - 0.12 T + 19.73 ( 0.87) with P < 0.05
Ecosystem Respiration & Discrimination Response to Temperature Changes (Fraserdale, ~ 50N) 13CER = 0.068 T 27.12 ( 0.26) When T 0, d13CER d13CAR d13CPlant givend13CBg-Air≈ - 8, DPh = (13CBg-Air - 13CPlant ) = (-8)- (-27.12) = 19.12 ‰ DEco= - 0.12 T + 19.73 ( 0.87) When T 0, ΔEco ΔPh = 19.73 0.87‰ Model (BEPS 2.0) calculation: DPh = 19.79 0.35 ‰
Ecosystem Discrimination & the Difference of CO2 ( FT- PBL) (Fraserdale, ~ 50N) ΔEco = -0.25 ΔCO2FT-MBL+ 19.12 ( 0.55) with P < 0.02
Summary Regional ecosystem respiration & photosynthesis discrimination (of 13C) could be retrieved from atmospheric measurements. Ecosystem respiration (d13CER) and discrimination (DEco) are response to temperature changes and DEco is likely more sensitive to temperature than d13CER. Ecosystem discrimination (DEco) on regional scale is likely correlated with the CO2 concentration difference between free troposphere (FT) and PBL
Acknowledgement SongMiao Fan John Miller Misa Ishizawa Douglas Chan For valuable discussion Thomas J Conway Kenneth Masarie Patricia M Lang Bruce Vaughn Jim White For producing and making the MBL data available