Download
1 / 15
150 likes | 246 Views
Using CMAQ to Quantify the Climate Change Impacts of US Reactive Nitrogen Emissions: Source Attribution and Bounding Uncertainty. CH 4 (decade) N 2 O (century) CO 2 (centuries). Greenhouse gases. Aerosols (days) O 3 (weeks). Short-lived forcers. Combustion Emissions: NO x ,

E N D
Using CMAQ to Quantify the Climate Change Impacts of US Reactive Nitrogen Emissions: Source Attribution and Bounding Uncertainty
CH4 (decade) N2O (century) CO2 (centuries) Greenhouse gases Aerosols (days) O3 (weeks) Short-lived forcers Combustion Emissions: NOx, N2O, and NH3 Natural Landscapes Ag. Emissions: NH3, N2O, and NOx Uptake and emission of (increase uptake) CO2 (increase emission) CH4 (increase emission) N2O
How to compare impacts across multiple timescales? How to quantify the myriad of multi-media interactions? Need a common metric.
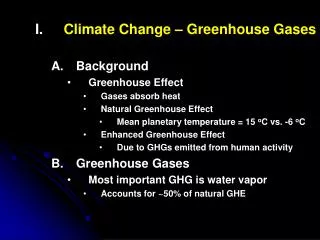
Metric: Global Temperature Potential • Change in temperature at time t due to a 1 kg pulse of emissions • Expressed in CO2 equivalents • Calculated for a specific time t • GTP20 or GTP100 • For short-lived species, GTP20 >> GTP100
Qualitative example adapted from Shine et al. 2006 20 years 20 years 100 years 100 years 20 years 100 years
Goal: Calculate climate change impact of anthropogenic N depositionPrinciples: • Empirical data where possible • Bounding exercise • Quantify uncertainties and propagate through analysis
Approach: • Calculate N deposition from CMAQ • Map to land cover: forest, grassland, cropland • Convert N deposition to GHG flux using two types of empirical studies • Meta-analysis of controlled experiments: (Liu and Greaver, 2009) • Gradient study of Northeastern US forests: (Thomas et al., 2010)
Conclusions • Reactive nitrogen from US combustion sources is likely causing cooling • Reactive nitrogen from US agricultural sources is likely causing warming • Combustion sources are declining • Agricultural sources are likely increasing, but best management practices are available
Motivation • We have substantially altered the nitrogen cycle • The nitrogen and carbon cycles are inter-connected • Critical to designing policies for • Climate change mitigation • Ecosystem health • Air quality management