Download

1 / 11
110 likes | 241 Views
Derivation of Taxonomic Screening Values. Taxonomic Screening Values. Our background thinking…. Taxonomic Screening Values. Our background thinking… The use of generic screening values identifies the most exposed BUT is not necessarily the most at risk organism

E N D
Taxonomic Screening Values • Our background thinking…
Taxonomic Screening Values • Our background thinking… • The use of generic screening values identifies the most exposed BUT is not necessarily the most at risk organism • Having taxonomic screening values could aid regulation
Taxonomic Screening Values • Our background thinking… • The use of generic screening values identifies the most exposed BUT is not necessarily the most at risk organism • Having taxonomic screening values could aid regulation • Initially, thought to apply SSD approach to derive PNEDRs for each constituent grouping (e.g. vertebrates, plants, invertebrates) • Ideally, want all appropriate taxonomic groups
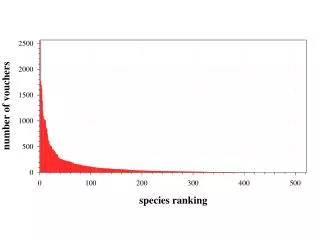
Taxonomic Screening Values • Using data such as the UNSCEAR figure (already discussed) thought this might help determine groupings
Taxonomic Screening Values • Using data such as the UNSCEAR figure (already discussed) thought this might help determine groupings • Accepting that this was an inappropriate endpoint, we initially proposed the following: Vertebrates, Invertebrates, Higher and Lower plants • BUT…
Taxonomic Screening Values • Evaluation of available effects data for inclusion in SSD clearly showed that we could not derive numbers for all the planned groups using the TGD
Taxonomic Screening Values • Evaluation of available effects data for inclusion in SSD clearly showed that we could not derive numbers for all the planned groups using the TGD • Note – it was felt that the most sensitive (vertebrates) might lead to PNEDR which was lower than generic screening value
Taxonomic Screening Values • Evaluation of available effects data for inclusion in SSD clearly showed that we could not derive numbers for all the planned groups using the TGD • Note – it was felt that the most sensitive (vertebrates) might lead to PNEDR which was lower than generic screening value • If this proved to be the case, proposed to replace the generic screening value with the lowest PNEDR
Taxonomic Screening Values • Sensitivity analysis of the limited data sets showed that only removing the vertebrates made any difference to the overall SSD • Key issue is the limited data sets for each taxonomic group
Taxonomic Screening Values • Sensitivity analysis of the limited data sets showed that only removing the vertebrates made any difference to the overall SSD • Key issue is the limited data sets for each taxonomic group • Is our CONCEPT for the derivation of the taxonomic screening values clear?