Download
1 / 20
250 likes | 434 Views
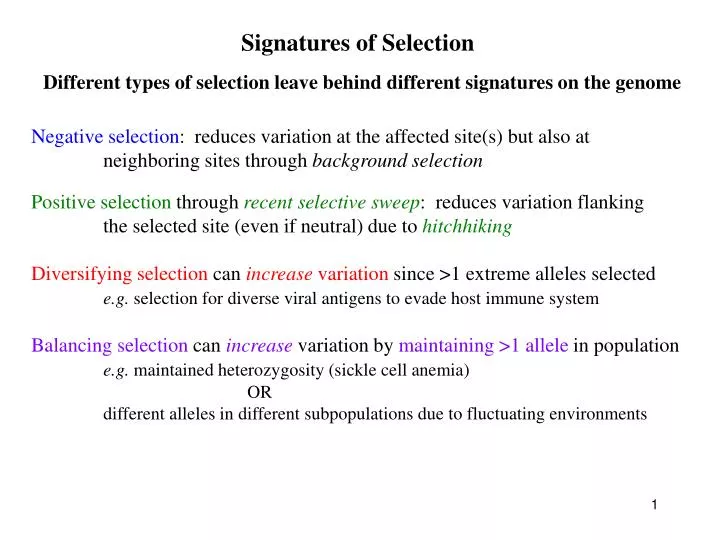
Signatures of Selection. Different types of selection leave behind different signatures on the genome. Negative selection : reduces variation at the affected site(s) but also at neighboring sites through background selection.

E N D
Signatures of Selection Different types of selection leave behind different signatures on the genome Negative selection: reduces variation at the affected site(s) but also at neighboring sites through background selection Positive selection through recent selective sweep: reduces variation flanking the selected site (even if neutral) due to hitchhiking Diversifying selection can increase variation since >1 extreme alleles selected e.g. selection for diverse viral antigens to evade host immune system Balancing selection can increase variation by maintaining >1 allele in population e.g. maintained heterozygosity (sickle cell anemia) OR different alleles in different subpopulations due to fluctuating environments
Signatures of Selection Also different methods of looking for these signatures 1. Evolutionary rate within species vs. between species e.g.Ka/Ks ratio & McDonald-Kreitman tests for coding sequences HKAand multi-locus HKA tests for non-coding sequences 2. Frequency spectrum: frequency of different alleles in the population e.g. Tajima’s D … Fay & Wu’s H … Fu & Li’s D* 3. Linkage disequillibrium & Haplotype structure For all of these tests: compare REAL DATA to a MODEL of what data should look like under neutral evolution … can also compare test results at specific loci vs. a scan across the genome
Signatures of Selection Also different methods of looking for these signatures 1. Evolutionary rate within species vs. between species e.g.Ka/Ks ratio & McDonald-Kreitman tests for coding sequences HKAand multi-locus HKA tests for non-coding sequences 2. Frequency spectrum: frequency of different alleles in the population e.g. Tajima’s D … Fay & Wu’s H … Fu & Li’s D* 3. Linkage disequillibrium & Haplotype structure For all of these tests: compare REAL DATA to a MODEL of what data should look like under neutral evolution … can also compare test results at specific loci vs. a scan across the genome
Methods based on the Allele Frequency Spectrum 1. For each ‘derived’ (=non-ancetsral) allele at a given locus, calculate the frequency. Some alleles will be at high frequencies in the population, some at low frequencies (i.e. very uncommon) • Make a histogram of the % of alleles with different frequencies looking for an excess of rare alleles or of common alleles From Nielsen Nat Rev Gen 2005 review
Methods based on the Allele Frequency Spectrum Tajima’s D(F. Tajima, 1989): takes the # of segregating sites within species (S) and also the average # difference between each pair of sequences () S = 3 = (2 + 2 + 1 + 2) + (2 + 1 + 0) + (1 + 2) +(1) = 1.4 avg. # difs between each pair of sequences 10 pairwise comparisons Tajima’s D compares S and to estimate the proportion of low/high-frequency alleles
Methods based on the Allele Frequency Spectrum Tajima’s D(F. Tajima, 1989): takes the # of segregating sites within species (S) and also the average # difference between each pair of sequences () S versus reflects on allele frequency Multiple ways to calculate q q = …. q = S/a Negative Tajima’s D = excess of low-frequency alleles (= reduced variation) (< S/a) Indicates positive selection, OR recent deleterious alleles, OR population expansion** Positive Tajima’s D = excess of intermediate-frequency alleles (> S/a) (low amounts of both high- and low-frequency alleles) Indicates balancing selection OR partial sweep OR population bottleneck** How can you get a p-value? Difficult to estimate - best to compare across loci
Empirical model for significance of Tajima’s D Sliding window across a locus OR Compare to several other loci From Nielsen Nat Rev Gen 2005 review From Will et al.PLoS Genetics 2010
Genome-wide scans of FST FST is a measure of population subdivision: the proportion of the total genetic variance T contained in a subpopulation S relative to the total genetic variance in the species T - S FST = T Where = average # pairwise nucleotide differences per site If S =T (i.e amount of variation in the subpopulation is same as total population) FST = 0 … NO population subdivision If there’s variation in the total sample, but NO variation within each subpopulation S =FST = 1 … COMPLETE differentiation between subpopulations
FST = 1: very strong population subdivisions … may be little gene flow between those populations
Genome-wide scans of FST Difficult to interpret what a given FST means (FST = 0.15 means ???) But, can use variation in FST across the genome to look for evidence of partial selective sweeps in specific sub-populations: i.e. little gene flow at specific loci only
LD & Haplotype Structure Linkage equillibrium: when segregation of two different alleles is independent of one another Linkage disequillibrium (LD): segregation of two alleles are NOT random - two SNPs in close proximity are linked physically - can measure the distance over which their association breaks down LD break-down depends on generation time and recombination rate SNPs very close together will take many generations to get separated
LD & Haplotype Structure Linkage equillibrium: when segregation of two different alleles is independent of one another Linkage disequillibrium (LD): segregation of two alleles are NOT random - two SNPs in close proximity are linked physically - can measure the distance over which their association breaks down Haplotype: block of linked SNPs Haplotype 1 at Locus A Haplotype 2 at Locus A Haplotype 3 at Locus A
LD & Haplotype Structure Remember that a recent selective sweep can reduce variation flanking the advantageous site. The strength of selection and time since sweep affects the degree and length of reduced variation. This effectively creates an unusually long haplotype (compared to others in the genome)
EHH: Extended Haplotype Homozygosity test for RECENT positive selection Recent positive selection through partial selective sweep: * extended haplotype length * high frequency in subpopulation must account for regional differences in recombination rates Yoruban Beni African Shona European Asian
EHH: Extended Haplotype Homozygosity test for RECENT positive selection EHH = % of individuals sharing CORE haplotype that remain identical out to a distance of x Defined Core Haplotype
EHH: Extended Haplotype Homozygosity test for RECENT positive selection Relative EHH: normalize EHH for one haplotype to EHH of all others at that locus internally controls for locus-specific effects African haplotype
EHH: Extended Haplotype Homozygosity (& other methods) test for RECENT positive selection Related test from Jonathan Pritchard: iHS test Benefits of EHH & iHS scans: * Don’t have to know populations a priori … define by haplotypes * More sensitive than traditional tests for selection Remaining challenges: * Often have no idea WHY - how to link to phenotypes of interest? Stinchcombe & Hoekstra review: combining scans with QTL mapping * Often unclear what SNP was selected for … identifies huge regions
Science. February 12, 2010 CMS incorporates results of 5 different tests: FST iHS & XP-EHH DAF (looking at derived allele frequencies) iHH (looking at absolute haplotype length)