Download
1 / 31
310 likes | 397 Views
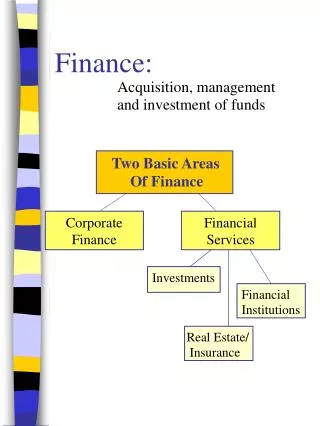
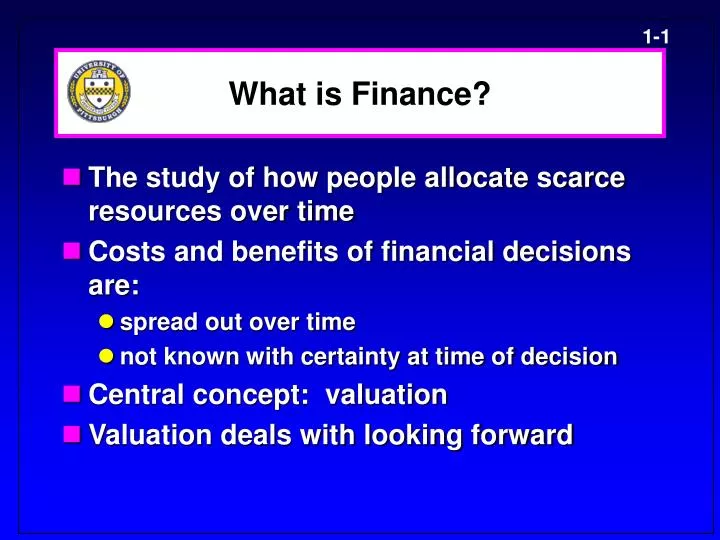
What is Finance?. The study of how people allocate scarce resources over time Costs and benefits of financial decisions are: spread out over time not known with certainty at time of decision Central concept: valuation Valuation deals with looking forward.

E N D
What is Finance? • The study of how people allocate scarce resources over time • Costs and benefits of financial decisions are: • spread out over time • not known with certainty at time of decision • Central concept: valuation • Valuation deals with looking forward
A Simplified Organizational Chart (Figure 1.1) Board of Directors Chairman of the Board and Chief Executive Officer (CEO) President and Chief Operations Officer (COO) Vice President Production Vice President Marketing Vice President Finance (CFO) Controller Treasurer Cost Accounting Manager Cash Manager Credit Manager Tax Manager Financial Accounting Manager Data Processing Manager Financial Planning Capital Expenditures
The Corporation • Advantages • unlimited life • easy transfer of ownership • limited liability • ease of raising capital • Disadvantages • double taxation • set-up and reporting costs • agency costs
Goal of Financial Management • What are firm decision-makers hired to do? “General Motors is not in the business of making automobiles. General Motors is in the business of making money.” Alfred P. Sloan • Possible goals • Three equivalent goals of financial management: • maximize shareholder wealth • maximize share price • maximize firm value
Agency Relationships • An agency relationship exists whenever a principal hires an agent to act on their behalf • Within a corporation, agency relationships exist between: • shareholders and managers • shareholders and creditors
Shareholders versus Managers • Managers are naturally inclined to act in their own best interests • But the following factors affect managerial behavior: • compensation plans • direct intervention by shareholders • threat of firing • threat of takeover • Board of Directors
Shareholders versus Creditors • Shareholders could take actions to maximize stock price that are detrimental to creditors • In the long run, such actions will raise the cost of debt and ultimately lower stock price
Factors that Affect Stock Price • Projected cash flows to stockholders • Timing of the cash flow stream • Risk of the cash flows • VALUE (price) = the discounted value of all relevant future cash flows • P = t CFt× (1 + r )–t
Computing Cash Flows • Why Do We Care About This Topic? • Financial managers need accurate forecasts of cash flows to make accurate investment and financing decisions • Investment bankers and deal makers need to know how much to bid for a company in an acquisition and/or merger • Managers need to know how much cash flow is generated by assets to get feedback on their strategic decisions • Investors and creditors need to know how much cash is generated from assets and operations to determine the financial solvency of a company
The Balance Sheet (Figure 2.1) Total Value of Liabilities and Shareholders’ Equity Total Value of Assets Net Working Capital Current Liabilities Current Assets Long-TermDebt Fixed Assets 1. Tangible fixed assets 2. Intangible fixed assets Shareholders’Equity
GAAP Net Income vs. Cash Flows • General Accepted Accounting Principles (GAAP) govern audited financial statements • The objective of GAAP is to provide a consistent account of a firm's financial status based on historical cost, where revenues and expenses are matched over the appropriate time period. • Cash flow does not equal GAAP net income. • GAAP recognizes revenue at time of sale, and matches expenses to these revenues, but cash flow may occur at different time. • Depreciation and other non-cash items are included in GAAP net income. • Items are recorded on an accrual basis, not when the money actually comes into the firm. • Cash Flow = difference between dollars in and dollars out
Cash Flow Summary 1. The cash flow identity Cash flow from assets = Cash flow to creditors (bondholders) + Cash flow to stockholders (owners) 2. Cash flow from assets Cash flow from assets = Operating cash flow – Net capital spending – Additions to net working capital (NWC) where: Operating cash flow = Earnings before interest and taxes (EBIT) + Depreciation – Taxes Net capital spending = Ending net fixed assets – Beginning net fixed assets + Depreciation Change in NWC = Ending NWC – Beginning NWC 3. Cash flow to creditors Cash flow to creditors = Interest paid – Net new borrowing 4. Cash flow to stockholders Cash flow to stockholders = Dividends paid – Net new equity raised
A Closer Look at Operating Cash Flow (OCF) • OCF = EBIT + Depreciation - Taxes • EBIT has already subtracted depreciation. • Depreciation is excluded from OCF. It is a non-cash item. By adding depreciation, we have a cash flow number that includes costs associated with operating activities and excludes non-cash items. • Taxes are included in OCF because the taxes are paid on the revenues associated with operating activities.
A Closer Look at NWC 100+110+100-80-70=160 50 • What is additions to NWC? • What does this number mean? Is it a cash inflow or a cash outflow?
Cash Flow Summary for Quincy A. Cash flow from assets 1. Operating cash flow = EBIT + Depreciation – Taxes = $500 + 100 – 200 = $400 2. Additions to Net Working Capital (-/-) = Ending NWC – Beginning NWC = $350 – $300 = $50 3. Net capital spending (-/-) = End. net fixed assets + Depreciation – Beg. net fixed assets = $500 + 100 – 400 = $200 4. Cash flow from assets = OCF – Additions to NWC – Net Capital spending = $400 – 50 – 200 = $150
Cash Flow Summary for Quincy, cont’d. B. Cash flow to creditors and stockholders 1. Cash flow to creditors = Interest paid – (Ending LTD - Beg. LTD) = $100 – ($420 - $400) = $80 2. Cash flow to stockholders = Dividends paid – (Ending Common - Beg. Common) = $80 – ($60 - $50) = $70 Check: $150 from assets = $80 to bondholders + $70 to stockholders
Statement of Cash Flows • Summarizes the flow of cash receipts (inflows) and cash payments (outflows) during a given period of time • summarizes sources and uses of cash • reconciles change in cash balance over time • Restatement of balance sheet and income statement • 3 primary categories • operating activities • investing activities • financing activities
The Statement of Cash Flows • Operating activities • + Net income • + Depreciation • + Decrease in current assets (except cash) • + Increase in current liabilities (not notes payable) • – Any increase in current assets (except cash) • – Decrease in current liabilities (not notes payable) • Investment activities • – (Increase in net fixed assets + Depreciation)
Statement of Cash Flows, cont’d. • Financing activities • – Decrease in notes payable • + Increase in notes payable • – Decrease in long-term debt • + Increase in long-term debt • – Decrease in common stock • + Increase in common stock • – Dividends paid
Hermetic Inc., Balance Sheet as of December 31 ($ in thousands) Assets 1995 1996 Current assets Cash $ 45 $ 50 Accounts receivable 260 310 Inventory 320 385 Total $ 625 $ 745 Fixed assets Net plant and equipment 985 1100 Total assets $1610 $1845
Hermetic Inc., Balance Sheet Liabilities and equity 1995 1996 Current liabilities Accounts payable $ 210 $ 260 Notes payable 110175 Total $ 320 $ 435 Long-term debt 205 225 Stockholders’ equity Common stock and paid-in surplus 290 290 Retained earnings 795895 Total $1085 $1185 Total liabilities and equity $1610 $1845
Hermetic Inc., Income Statement ($ in thousands) Net sales $710.00 Cost of goods sold 480.00 Depreciation 30.00 Earnings before interest and taxes $200.00 Interest 20.00 Taxable income 180.00 Taxes 53.45 Net income $126.55 Retained earnings $100.00 Dividend = $26.55
Cash Flow from Assets Cash flow from assets: Operating cash flow: EBIT $ 200.00 + Depreciation + 30.00 – Taxes – 53.45 $ 176.55 Net capital spending: Ending net fixed assets $ 1,100.00 – Beginning net fixed assets – 985.00 + Depreciation + 30.00 $ 145.00 Change in net working capital: Ending net working capital $ 310.00 – Beginning net working capital – 305.00 $ 5.00 Cash flow from assets: $ 26.55
Cash Flow from Assets, cont’d. Total cash flow to creditors and stockholders: • Cash flow to creditors: Interest paid $ 20.00 – Net new borrowing – 20.00 $ 0.00 • Cash flow to stockholders: Dividends paid $ 26.55 – Net new equity raised- 0.00 $ 26.55 Cash flow to creditors and stockholders $ 26.55
Hermetic Inc., Statement of Cash Flows • Operating activities • + Net income + 126.55 • + Depreciation + 30.00 • + Increase in payables + 50.00 • – Increase in receivables – 50.00 • – Increase in inventory – 65.00 91.55 • Investment activities • – Increase in net fixed assets – 115.00 • – Depreciation – 30.00 (145.00)
Hermetic Inc., Statement of Cash Flows • Financing activities • + Increase in notes payable + 65.00 • + Increase in long-term debt + 20.00 • + Increase in equity 0.00 • – Dividends – 26.55 58.45 Putting it all together 91.55 – 145.00 + 58.45 = 5.00
Identify whether an activity is an operating activity (O), investment activity (I), financing activity (F) and if it is a source (+) or use (-) of cash. Operating Source Use Operating Investment Source Financing Source