Download
1 / 15
150 likes | 237 Views
Economic and Policy Context of Woody Biomass Utilization for Electric Power. Healthy Landscapes, Thriving Communities Bioenergy and Wood Products Conference January 21, 2004 – Denver. Dr. Mark Nechodom, US Forest Service Pacific Southwest Research Station. Mapping the Biomass Territory.

E N D
Economic and Policy Context of Woody Biomass Utilization for Electric Power Healthy Landscapes, Thriving Communities Bioenergy and Wood Products Conference January 21, 2004 – Denver Dr. Mark Nechodom, US Forest Service Pacific Southwest Research Station
Mapping the Biomass Territory With grateful acknowledgements to Bob Shleser
A Pricing Problem? Huh…?!
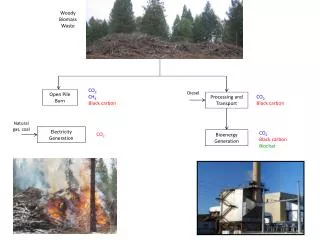
Costs From Forest to Bus Bar = 7.5¢/kWh Sources: Nechodom, Mason & Hartsough in press; TSS Consultants Unpubl.
(Based on California Wholesale Markets, 2002) Potential Income and Avoided Costs (public benefits) = 18.7 cents/kWh Sources: Morris 1999; Nechodom & TSS (unpubl)
(Based on California Wholesale Markets, 2002) Potential Income and Avoided Costs (public benefits) = 18.7 cents/kWh Huh…?! Sources: Morris 1999; Nechodom & TSS (unpubl)
Timber losses Watershed damage Water treatment Tourism and recreation Amenity values Wildlife habitat Disaster relief costs Lost jobs and wages Rehabilitation and restoration costs Transportation (movement of goods and services) Human health Evacuation and displacement Cultural and archeological sites Environmental and Social Impacts and Costs of Wildfire: At What Price?
How much does it cost? How much do I get in return? How do we calculate risk? What is “it”? (what is the level of public investment?) (who benefits? who pays? (what if we don’t invest?) (what exactly are you planning to do out there?) The Forest Thinning Problem:
“Creating” Renewable Energy Markets • Public Goods Funds: taken off the top of ratepayer bills; allocated by govt or utility • Renewable Portfolio Standards: require the market (suppliers and consumers) to respond • Green Power Pricing: connecting demand (consumers) to supply (e.g., biomass plants) • Subsidies: transfers financial resources from taxpayers to ratepayers
Renewable Energy “Public Goods Funds” $10 mil. $94 mil. MA: $332 mil $95 mil. $32 mil. $85 mil. RI: $10 mil $80 mil. CT: $275 mil $20 mil. $127 mil. NJ: $271 mil. DE: $11 mil. $1890 mil. • 16 states with renewable funds • $4.3 billion to be collected through 2012 $40 mil. $234 mil. Source: Lawrence Berkeley National Laboratory
States with Renewable Portfolio Standards ME: 30% by 2000 MN: 825 MW by 2012 WI: 2.2% by 2011 MA: 4% new by 2009 CT: 13% by 2009 NV: 15% in 2013 IA: 105 MW NJ: 6.5% by 2012 PA: varies by utility CA: 20% by 2017 • 13 states • ~33% of total U.S. load covered AZ: 1.1% by 2007 NM: 10% by 2011 TX: 2,880 MW by 2009 Source: LBL, NREL, author
Almost half of US electricity customers have access to a green power product
Policy-Level Support • MOU on Biomass Utilization – USDA, DOE, DOI – Signed June 16, 2003 • Healthy Forest Restoration Act (HR 1904 – Title II: Biomass) • Increased policy-level interest in translating forest investments into cost-savings and revenues