Download
1 / 1
10 likes | 13 Views
In 2012, Utah State University published a survey of water main break rates in the United States and Canada. This survey was repeated and a new report published recently. The goal of both surveys was to get a measure of overall status of water main infrastructure.

E N D
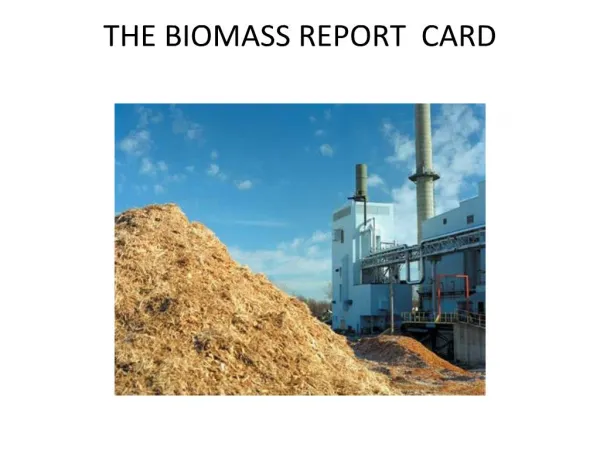
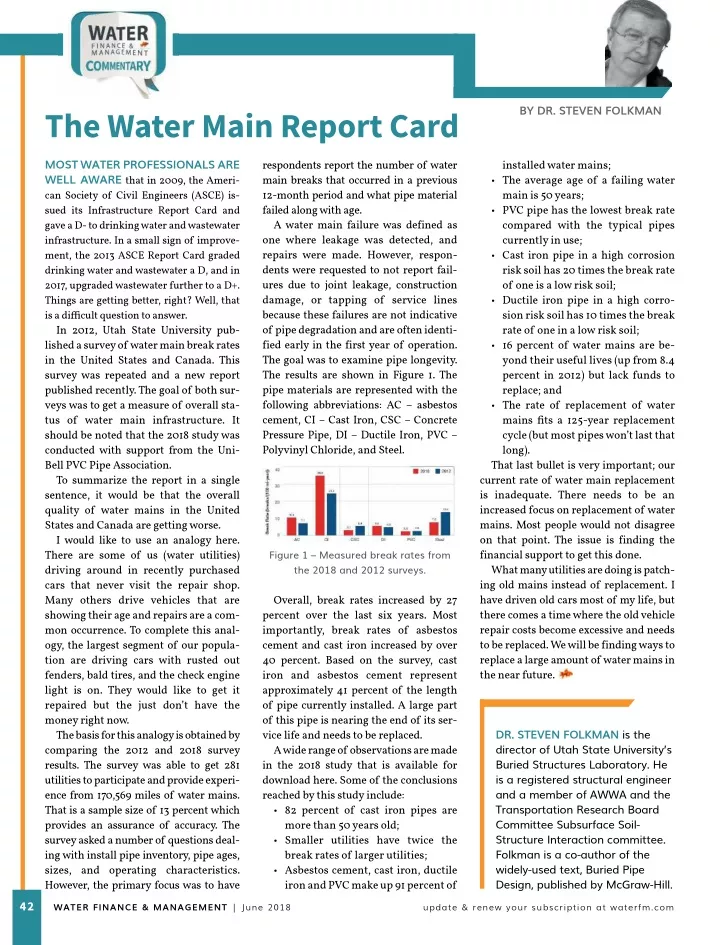
BY DR. STEVEN FOLKMAN The Water Main Report Card respondents report the number of water main breaks that occurred in a previous 12-month period and what pipe material failed along with age. A water main failure was defined as one where leakage was detected, and repairs were made. However, respon- dents were requested to not report fail- ures due to joint leakage, construction damage, or tapping of service lines because these failures are not indicative of pipedegradation and are often identi- fiedearly in thefirst year of operation. The goal was to examine pipe longevity. The results are shown in Figure 1. The pipe materials are represented with the following abbreviations: AC – asbestos cement, CI – Cast Iron, CSC – Concrete Pressure Pipe, DI – Ductile Iron, PVC – Polyvinyl Chloride, and Steel. installed water mains; • The average age of a failing water main is 50 years; • PVC pipehas the lowest break rate compared with the typical pipes currently in use; • Cast iron pipe in a high corrosion risk soil has 20 times the break rate of one is a low risk soil; • Ductile iron pipe in a high corro- sion risk soil has 10 times the break rate of one in a low risk soil; • 16 percent of water mains are be- yond their useful lives (up from 8.4 percent in 2012) but lack funds to replace; and • The rate of replacement of water mains fjts a 125-year replacement cycle (but most pipes won’t last that long). That last bullet is very important; our current rate of water main replacement is inadequate. There needs to be an increased focus on replacement of water mains. Most people would not disagree on that point. The issue is finding the financial support to get this done. What many utilities are doing is patch- ing old mains instead of replacement. I have driven old cars most of my life, but there comes a time where the old vehicle repair costs become excessive and needs to be replaced. We will befinding ways to replace a large amount of water mains in the near future. MOST WATER PROFESSIONALS ARE WELL AWAREthat in 2009, the Ameri- can Society of Civil Engineers (ASCE) is- sued its Infrastructure Report Card and gave a D- to drinking water and wastewater infrastructure. In a small sign of improve- ment, the 2013 ASCE Report Cardgraded drinking water and wastewater a D, and in 2017, upgraded wastewater further to a D+. Things are getting better, right? Well, that is a diffjcult question to answer. In 2012, Utah State University pub- lished a survey of water main break rates in the United States and Canada. This survey was repeated and a new report published recently. The goal of both sur- veys was to get a measure of overall sta- tus of water main infrastructure. It should be noted that the 2018 study was conducted with support from the Uni- Bell PVC Pipe Association. To summarize the report in a single sentence, it would be that the overall quality of water mains in the United States and Canada are getting worse. I would like to use an analogy here. There are some of us (water utilities) driving around in recently purchased cars that never visit the repair shop. Many others drive vehicles that are showing their age and repairs are a com- mon occurrence. To complete this anal- ogy, the largest segment of our popula- tion are driving cars with rusted out fenders, bald tires, and the check engine light is on. They would like to get it repaired but the just don’t have the money right now. The basis for this analogy is obtained by comparing the 2012 and 2018 survey results. The survey was able to get 281 utilities to participate and provide experi- encefrom 170,569 miles of water mains. That is a sample size of 13 percent which provides an assurance of accuracy. The survey asked a number of questions deal- ing with install pipe inventory, pipe ages, sizes, and operating characteristics. However, the primary focus was to have Figure 1 – Measured break rates from the 2018 and 2012 surveys. Overall, break rates increased by 27 percent over the last six years. Most importantly, break rates of asbestos cement and cast iron increased by over 40 percent. Based on the survey, cast iron and asbestos cement represent approximately 41 percent of the length of pipe currently installed. A large part of this pipe is nearing the end of its ser- vice life and needs to be replaced. A wide range of observations are made in the 2018 study that is availablefor download here. Some of the conclusions reached by this study include: • 82 percent of cast iron pipes are more than 50 years old; • Smaller utilities have twice the break rates of larger utilities; • Asbestos cement, cast iron, ductile iron and PVC make up 91 percent of DR. STEVEN FOLKMAN is the director of Utah State University’s Buried Structures Laboratory. He is a registered structural engineer and a member of AWWA and the Transportation Research Board Committee Subsurface Soil- Structure Interaction committee. Folkman is a co-author of the widely-used text, Buried Pipe Design, published by McGraw-Hill. 42 WATER FINANCE & MANAGEMENT | June 2018 update & renew your subscription at waterfm.com