Download
1 / 14
150 likes | 263 Views
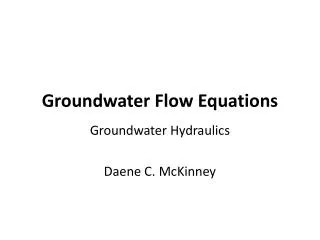
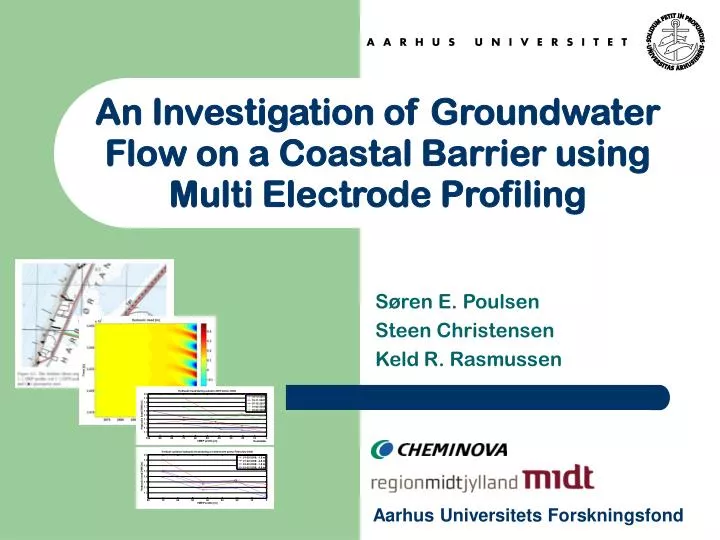
An Investigation of Groundwater Flow on a Coastal Barrier using Multi Electrode Profiling . Søren E. Poulsen Steen Christensen Keld R. Rasmussen. Aarhus Universitets Forskningsfond. Outline. Purpose Field site & Instrumentation Method Data acquisition & Processing Interpretation

E N D
An Investigation of Groundwater Flow on a Coastal Barrier using Multi Electrode Profiling Søren E. Poulsen Steen Christensen Keld R. Rasmussen Aarhus Universitets Forskningsfond
Outline • Purpose • Field site & Instrumentation • Method • Data acquisition & Processing • Interpretation • Results & Conclusions • Example 1: March 2008, winter scenario • Example 2: June 2008, summer scenario
Purpose • Obtain detailed information about the resistivity and salinity distribution of a shallow coastal aquifer by means of vertical multi electrode profiling (VMEP) • Validate modeled formation resistivities by calculating formation factors and comparing these with expected values
VMEP profile Fieldsite 1000 m N Beach Dunes/dike Canal Lagoon
Sand Silty Finesand Clay Instrumentation NW SE 8 E3 E2 E4 E5 E1 Water table 2 0 -2 Meters above m.s.l. [m] -4 Expected salt/fresh water interface -9 110 135 155 60 85 Approximate distance from the coastline [m]
Instrumentation • 32 or 28 electrodes on each probe • Electrode spacing 0.25 m • Probes are connected to standard MEP equipment
Data aquisition & Processing • DC protocols • GRADIENT, high vertical resolution, suited for mapping structures perpendicular to the probe • DIPOL-DIPOL, large horizontal penetration depth • Processing • Identifying and exterminating outliers • Assessing the amount of reliable data • Evaluate protocols
Interpretation • Layered 1D model SELMA (Simultaneous Electromagnetic Layered Model Analysis) AIR 1, b1, d1 VMEP probe 2, b2, d2 . Model layers . n-1, bn-1, dn-1 n [SELMA – research software, Niels B. Christensen]
Interpretation • Inversion performed by an L2-norm broad-band covariance regularization* • 60 layer model, constant layer thickness = electrode spacing = 0.25 m • 2 models per probe • One more tightly bound to the reference model than the other *[Serban D. Z. and Jacobsen B. H. 2001]
Results • Example 1: March 2008, winter scenario • Low potential evapotranspiration • Following a period of steady freshwater infiltration • Freshwater dominated • Example 2: June 2008, summer scenario • High potential evapotranspiration • Low infiltration • Brackish/saline dominated
NW SE E5 E4 E3 E2 E1 (+) = water sample point
Conclusions • High quality VMEP data can be acquired and inverted into reasonable, high resolution models of formation resistivity • Formation factors are within a reasonable range especially for the well-determined June 2008 models Acknowledgements:Niels B. Christensen, Anders V. Christiansen, Jesper S. Mortensen & Andrea Viezzoli. University of Aarhus.