Download
1 / 29
320 likes | 493 Views
Microeconomics 3070-001. Lecture 1: Introduction. Syllabus and Website. Website: http://www.colorado.edu/ibs/hb/barham/courses/econ3070/ All assignments and solution keys will be posted on the web site. I will send you a notice when they are posted. Syllabus. Outline. Cover chapter 1

E N D
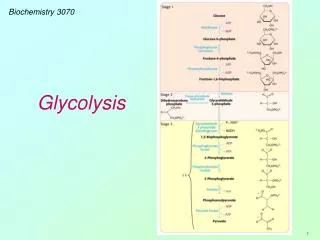
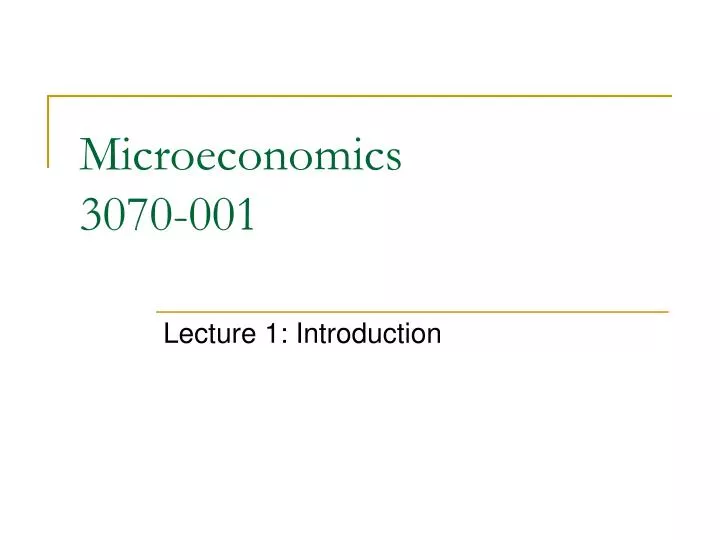
Microeconomics 3070-001 Lecture 1: Introduction
Syllabus and Website Website: http://www.colorado.edu/ibs/hb/barham/courses/econ3070/ • All assignments and solution keys will be posted on the web site. • I will send you a notice when they are posted. • Syllabus
Outline Cover chapter 1 • What is microeconomics • Economic models • Tools for microeconomics • Constrained optimization • Marginal analysis • Equilibrium analysis • Comparative statics • Next class are going over calculus • Next week we will start chapter 2
What is mircoeconomics Can you buy all the clothing, vacations, sport equipment, health care, food, beauty products, yoga classes, seasons tickets to sport event, donations to charity you want? No Mircoeconomics helps you decide how much to spend and on what.
What is mircoeconomics Official Definitions: • Microeconomics is the study of how individuals and firms make themselves as well off as possible in a world of scarcity and the consequences of those individual decisions on the markets and the entire economy. • Microeconomics is the study of the allocation of scarce resources. • Mircoeconomics is also often called price theory. • This is to emphasize the important role that price plays. • Price not only thing studied – think of health care market
What is mircoeconomics Because we can’t have everything, we need to make trade-offs and microeconomics helps us make those tradeoffs. A society faces 3 key tradeoffs: • Which goods and services to produce • How to produce them • How much labor and inputs should a firm use to produce a car • Who gets the good and services (allocation)
What is microeconomics • Workers need to choose how to allocate their time between labor and leisure. • Firms need to choose how to allocate their investment between human capital and machines. • Households need to choose how to allocate their incomes between savings and expenditure.
Micro versus Macroeconomics What is the difference between micro and macro economics? • Microeconomics: behavior of individual economic units like consumers, producers, landowners, families, etc. How and why do they make the decisions they make? • Macroeconomics: analyzes how the entire national economy performs. It analyzes unemployment, inflation, price levels, interest rates (many things we take as given in microeconomics).
Economic Models How do economists allocate resources? They develop theoretical model. “Everything should be made a simple as possible but not simpler” Albert Einstein
Economic Models • The models are abstractions of the real world • Too complicated to take into consideration all factors • Without simplifications we would not be able to make predictions. • Like a roadmap, does not give each house, but the bare essentials i.e. major streets, highways and sometime main attractions. • It may appear that the model makes heroic abstractions (assumptions) from the complexities of the real world.
Economic Models Example Determinants of Poster Demand on Campus You are advertising a big event for the freshman class how many posters will you need? • Factors in your model: • Price to make poster, size of freshman class • Factors not in your model: • Content of poster, placement of poster, relative size of poster • Are there any constraints to this model? • the amount of budget you have to spend on poster advertising.
Types of Variables in a Model Exogenous Variable: one whose value is taken as given in a model. Endogenous Variable: one whose value is determined within the model being studied Which factor(s) would have you taken as given in the poster example? • Price, size of freshman class (exogenous) Which factor(s) are determined by your model? • The quantity of posters needed (or demanded)
Tools of Microeconomic Analysis • Constrained Maximization • Equilibrium Analysis • Comparative Statics
Constrained Optimization Constrained optimization: an analytical tool used when a decision maker seeks to make the best (optimal) choice, taking into consideration possible restrictions on the choice.
Constrained Optimization This tool has two parts: • Objective function: is the relationship the decision maker seeks to optimize (maximize or minimize). • Constraint: limits or restrictions that are imposed on the decision maker
Constrained OptimizationExamples You want to maximize your happiness during your second year at CU. • Objective function: Happiness=f(days skied per month, beers per week). • Constraints: s.t. (subject to) Income, time for leisure
Marginal Analysis • Solution to a constrained optimization problem depends on the marginal impact of the decision variables on the value of the objective function. But what is marginal? • The term marginal tells us how the value of the objective function changes as a result of adding one unit of a decision variable.
Marginal Analysis • $100 on beer = 94 units of happiness • $75 beer plus $25 skiing = 96 units of happiness. • $50 on beer and $50 on skiing = 100 units of happiness. • Yes a day of skiing with a nice apres ski makes you very happy.
Marginal Analysis • You just did a constrained optimization problem • Optimize happiness (beer and skiing) subject to you $100 weekly entertainment budget. Max H(B, S) s.t. Ps*S + Pb*B=100 Where B= quantity of beer; Pb=price beer S=days of skiing; Ps=price skiing.
Equilibrium Analysis Price (P) Doctors visit Qd: demand Qs Supply 50 Equilibrium: Qd=Qs P* Excess Demand 25 Q1 10 Q2 . Quantity (Q) Number of appointments per day
Equilibrium Analysis • In a competitive market, equilibrium is achieved at a price at which the market clears – that is, at a price at which the quantity offered for sale just equals the quantity demanded by consumers. • Since Qd = Qs at P*, there is no upward or downward pressure on price. Hence, price could stay at P* indefinitely.
Equilibrium Analysis P Price ($) Doctors visit Qd: demand Qs Supply Excess Supply 70 50 8 13 Quantity (Q) Number appointments per day
Equilibrium Analysis P Price ($) Doctors visit Qd: demand Qs Supply 70 50 30 Excess Demand 5 13 Q Quantity Number of appointments per day per doctor
Comparative Statics • Examine how a change in an exogenous variable will affect the level of an endogenous variable. • First, look at the value of the endogenous variable at the initial level of the exogenous variable • Second, look at the value of the endogenous variable at the new level of the exogenous variable.
Comparative Statics Example P Price ($) Doctors visit D S 50 P* 10 . Q Number of appointments per day per doctor Q*
Comparative Statics Example • Suppose we are in China and there is an outburst of the Avian Flu. A few weeks later there are some new regulations put on doctors and they are unhappy about it. So they do a rotating strike. • How will these factors affect our Supply and Demand curve and the price?
Comparative Statics Example P Price ($) Doctors visit Outbreak of avian flu, D2 D1 S1 Moves demand to the right, but supply curve does not change P2 60 P1 50 10 . 13 Q Number of appointments per day per doctor Q1 Q2
Comparative Statics Example The rotating strike will lead to P Price ($) Doctors visit D2 S2 D1 A reduction in supply S1 This is a shift to the left 65 P3 11 Q Number of appointments per day per doctor Q3