Download
1 / 10
100 likes | 187 Views
EOC Review : 3-27-2012 Antibodies are composed primarily of amino acids. In which class of biomolecules would antibodies belong? A. nucleic acids C. proteins B. carbohydrates D. lipids The chemical equation below shows the reaction of glucose and oxygen.

E N D
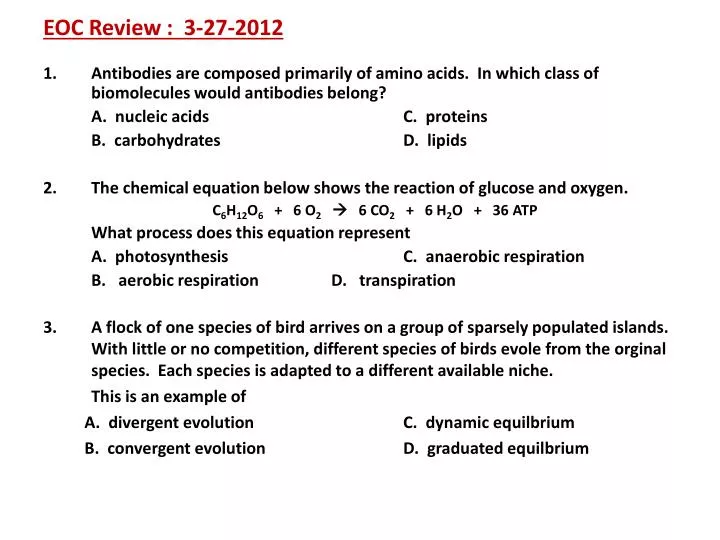
EOC Review : 3-27-2012 • Antibodies are composed primarily of amino acids. In which class of biomolecules would antibodies belong? A. nucleic acids C. proteins B. carbohydrates D. lipids • The chemical equation below shows the reaction of glucose and oxygen. C6H12O6 + 6 O2 6 CO2 + 6 H2O + 36 ATP What process does this equation represent A. photosynthesis C. anaerobic respiration B. aerobic respiration D. transpiration • A flock of one species of bird arrives on a group of sparsely populated islands. With little or no competition, different species of birds evole from the orginal species. Each species is adapted to a different available niche. This is an example of A. divergent evolution C. dynamic equilbrium B. convergent evolution D. graduated equilbrium
Population Genetics and Genetic Equilibrium • Variation of Traits Within a Population • Population genetics study of evolution from a genetic point of view. • Sometimes referred to as microevolution. • Refers to change in the collective genetic material of a population. • Population represents the smallest unit in which evolution occurs. • Within a population, individuals may vary in observable traits. • Example: fish of particular species in a pond may vary in size
Traits vary and can be mapped along a bell curve, which shows that most individuals have average traits, whereas a few individuals have extreme traits. • Causes of Variation • Some variations are influenced by environmental factors – amount or quality of food available. • Variation is also influenced by heredity. • Variations in genotype arise by mutation,recombination, and the random pairing of gametes.
The Gene Pool • The total genetic information available in a population is called the gene pool. • Phenotype frequency is equal to the number of individuals with a particular phenotype divided by the total number of individuals in the population. • Allele frequency is determined by dividing the total number of a certain allele by the total number of alleles of all types in the population.
Notice although the phenotype frequency can differ from generation to generation, the allele frequencies tend to remain the same. • From the allele frequencies we can predict the genotypes and phenotypes of the next generation. • Example : In a population of four o’clock flowers, the frequency of R allele is 0.75 and the frequency of the r allele is 0.25. • Calculate the predicted frequency of RR genotypes for the offspring of the next generation. • Calculate the predicted frequency of rr genotypes for the offspring of the next generation. • Calculate the predicted frequency of Rrgenotypes for the offspring of the next generation.
The Hardy-Weinberg Genetic Equilibrium • Allele frequencies in the gene pool do not change unless acted upon by certain forces. • First observed by two scientists named Hardy and Weinberg • Hardy-Weinberg genetic equilibrium is a theoretical model of a population in which no evolution occurs and the gene pool of the population is stable.
Five assumptions of Hardy-Weinberg model • 1. No net mutations occurs; the alleles in a population remain the same • 2. Individuals neither enter nor leave the population. • 3. The population is large • 4. Individuals mate randomly • 5. Selection does not occur • Genetic equilibrium is a theoretical state. By providing a model of how genetic equilibrium is maintained, the Hardy-Weinberg principle allows us to consider what forces disrupt genetic equilibrium.
Hardy-Weinberg Equation: p2 + 2 pq + q2 = 1 p = frequency of dominant allele in a gene pool for a given trait q = frequency of recessive allele in a gene pool for the same trait p + q = 1 (or 100%) “pq” is multiplied by two because there are two ways to get that combination. You can get p from male and q from female or q from male and p from female.
Case Study: PTC Tasters • People with ability to “taste” PTC determine by a dominant allele – “T” • “Non-tasters” are homozygous recessive – “tt” • Using class data, determine phenotypic frequency for this trait. • Determine the allele frequency. • How many individuals would you expect to be homozygous dominant? Heterozygous?