Download
1 / 1
10 likes | 107 Views
Phylogenetic Tree Based Taxonomic Classification Dongying Wu* 1,2 , Jonathan A. Eisen 2 1. DOE Joint Genome Institute, Walnut Creek, California 94598, USA 2. University of California, Davis, Davis, California 95616, USA. 2. Identify OTUs based on a phylogenetic tree

E N D
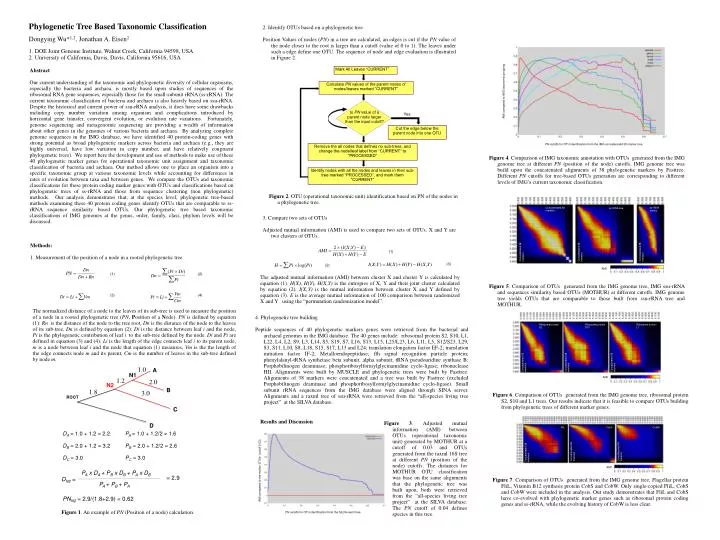
Phylogenetic Tree Based Taxonomic Classification Dongying Wu*1,2, Jonathan A. Eisen2 1. DOE Joint Genome Institute, Walnut Creek, California 94598, USA 2. University of California, Davis, Davis, California 95616, USA 2. Identify OTUs based on a phylogenetic tree Position Values of nodes (PN) in a tree are calculated, an edges is cut if the PN value of the node closer to the root is larger than a cutoff (value of 0 to 1). The leaves under such a edge define one OTU. The sequence of node and edge evaluation is illustrated in Figure 2. Ribosomal protein S2 Ribosomal protein S10 Ribosomal protein L1 Concatenated 38 markers ss-rRNA mothur ss-rRNA tree FliL CobW CobS Concatenated 38 markers Concatenated 38 markers Concatenated 38 markers Concatenated 38 markers Concatenated 38 markers Concatenated 38 markers Abstract Our current understanding of the taxonomic and phylogenetic diversity of cellular organisms, especially the bacteria and archaea, is mostly based upon studies of sequences of the ribosomal RNA gene sequences, especially those for the small-subunit rRNA (ss-rRNA). The current taxonomic classification of bacteria and archaea is also heavily based on ssu-rRNA. Despite the historical and current power of ssu-rRNA analysis, it does have some drawbacks including copy number variation among organism and complications introduced by horizontal gene transfer, convergent evolution, or evolution rate variations. Fortunately, genome sequencing and metagenomic sequencing are providing a wealth of information about other genes in the genomes of various bacteria and archaea. By analyzing complete genome sequences in the IMG database, we have identified 40 protein-coding genes with strong potential as broad phylogenetic markers across bacteria and archaea (e.g., they are highly universal, have low variation in copy number, and have relatively congruent phylogenetic trees). We report here the development and use of methods to make use of these 40 phylogenetic marker genes for operational taxonomic unit assignment and taxonomic classification of bacteria and archaea. Our method allows one to place an organism into a specific taxonomic group at various taxonomic levels while accounting for differences in rates of evolution between taxa and between genes. We compare the OTUs and taxonomic classifications for these protein coding marker genes with OTUs and classifications based on phylogenetic trees of ss-rRNA and those from sequence clustering (non phylogenetic) methods. Our analysis demonstrates that, at the species level, phylogenetic tree-based methods examining these 40 protein coding genes identify OTUs that are comparable to ss-rRNA sequence similarity based OTUs. Our phylogenetic tree based taxonomic classifications of IMG genomes at the genus, order, family, class, phylum levels will be discussed. Concatenated 38 markers Concatenated 38 markers Concatenated 38 markers Mark All Leaves “CURRENT” AMI AMI Calculate PN values of the parent nodes of nodes/leaves marked “CURRENT” AMI compared to IMG taxonomic grouping Is PN value of a parent node larger than the input cutoff? Yes PN cutoffs for OTU identification from the IMG concatenated 38 marker tree Cut the edge below the parent node into one OTU Figure 4. Comparison of IMG taxonomic annotation with OTUs generated from the IMG genome tree at different PN (position of the node) cutoffs. IMG genome tree was build upon the concatenated alignments of 38 phylogenetic markers by Fasttree. Different PN cutoffs for tree-based OTUs generation are corresponding to different levels of IMG’s current taxonomic classification. Remove the all nodes that defines no sub-trees, and change the node/leaf label from “CURRENT” to “PROCESSED” Figure 2. OTU (operational taxonomic unit) identification based on PN of the nodes in a phylogenetic tree. Identify nodes with all the nodes and leaves in their sub-tree marked “PROCESSED”, and mark them “CURRENT” 3. Compare two sets of OTUs Adjusted mutual information (AMI) is used to compare two sets of OTUs. X and Y are two clusters of OTUs. Methods: 1. Measurement of the position of a node in a rooted phylogenetic tree (1) (3) (2) AMI (1) (2) The adjusted mutual information (AMI) between cluster X and cluster Y is calculated by equation (1). H(X), H(Y), H(X,Y) is the entropies of X, Y and their joint cluster calculated by equation (2). I(X;Y) is the mutual information between cluster X and Y defined by equation (3). E is the average mutual information of 100 comparison between randomized X and Y using the “permutation randomization model”. Figure 5. Comparison of OTUs generated from the IMG genome tree, IMG ssu-rRNA and sequences similarity based OTUs (MOTHUR) at different cutoffs. IMG genome tree yields OTUs that are comparable to those built from ssu-rRNA tree and MOTHUR. (3) (4) The normalized distance of a node to the leaves of its sub-tree is used to measure the position of a node in a rooted phylogenetic tree (PN, Position of a Node). PN is defined by equation (1): Rn is the distance of the node to the tree root, Dn is the distance of the node to the leaves of its sub-tree. Dn is defined by equation (2): Di is the distance between leaf i and the node, Pi is the phylogenetic contribution of leaf i to the sub-tree defined by the node. Di and Pi are defined in equation (3) and (4): Li is the length of the edge connects leaf i to its parent node, m is a node between leaf i and the node that equation (1) measures, Vm is the the length of the edge connects node m and its parent, Cm is the number of leaves in the sub-tree defined by node m. 4. Phylogenetic tree building Peptide sequences of 40 phylogenetic markers genes were retrieved from the bacterial and archaeal genomes in the IMG database. The 40 genes include: ribosomal protein S2, S10, L1, L22, L4, L2, S9, L3, L14, S5, S19, S7, L16, S13, L15, L25/L23, L6, L11, L5, S12/S23, L29, S3, S11, L10, S8, L18, S15, S17, L13 and L24; translation elongation factor EF-2; translation initiation factor IF-2; Metalloendopeptidase; ffh signal recognition particle protein; phenylalanyl-tRNA synthetase beta subunit, alpha subunit; tRNA pseudouridine synthase B; Porphobilinogen deaminase; phosphoribosylformylglycinamidine cyclo-ligase; ribonuclease HII. Alignments were built by MUSCLE and phylogenetic trees were built by Fasttree. Alignments of 38 markers were concatenated and a tree was built by Fasttree (excluded Porphobilinogen deaminase and phosphoribosylformylglycinamidine cyclo-ligase). Small subunit rRNA sequences from the IMG database were aligned through SINA server. Alignments and a raxml tree of ssu-rRNA were retrieved from the “all-species living tree project” at the SILVA database. 1.0 A N1 AMI 1.2 2.0 N2 B 1.8 3.0 Figure 6. Comparison of OTUs generated from the IMG genome tree, ribosomal protein S2, S10 and L1 trees. Our results indicate that it is feasible to compare OTUs building from phylogenetic trees of different marker genes. ROOT C Results and Discussion Figure 3. Adjusted mutual information (AMI) between OTUs (operational taxonomic unit) generated by MOTHUR at a cutoff of 0.03 and OTUs generated from the raxml 16S tree at different PN (position of the node) cutoffs. The distances for MOTHUR OTU classification was base on the same alignments that the phylogenetic tree was built upon, both were retrieved from the “all-species living tree project” at the SILVA database. The PN cutoff of 0.04 defines species in this tree. D DA= 1.0 + 1.2 = 2.2 PA= 1.0 + 1.2/2 = 1.6 DB= 2.0 + 1.2 = 3.2 PB= 2.0 + 1.2/2 = 2.6 DC= 3.0 PC= 3.0 AMI AMI compared to the mothur OTUs (cutoff 0.03) PA x DA + PB x DB + PA x DB = 2.9 DN2= Figure 7. Comparison of OTUs generated from the IMG genome tree, Flagellar protein FliL, Vitamin B12 synthesis protein CobS and CobW. Only single-copied FliL, CobS and CobW were included in the analysis. Out study demonstrates that FliL and CobS have co-evolved with phylogenetic marker genes such as ribosomal protein coding genes and ss-rRNA, while the evolving history of CobW is less clear. PA + PB + PA PNN2= 2.9/(1.8+2.9) = 0.62 Figure 1. An example of PN (Position of a node) calculation. PN cutoffs for OTU identification from the SILVA raxml tree 99,000 random sampling of the 74,789,356 pairs


