Download
1 / 30
300 likes | 470 Views
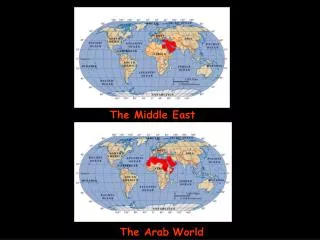
The Challenges to Implementing an AMR System in the Middle East. Presented By: Maha Chalouhi Chalhoub NEEDS Near East Engineering and Development Services. Date: February 1, 2005. Energy Status in the Middle East AMR Enterprise Solution AMR Challenges in the Area AMR Potential.

E N D
The Challenges to Implementing an AMR System in the Middle East Presented By: Maha Chalouhi Chalhoub NEEDS Near East Engineering and Development Services Date: February 1, 2005
Energy Status in the Middle East AMR Enterprise Solution AMR Challenges in the Area AMR Potential February 1, 2005 Table of Content 2
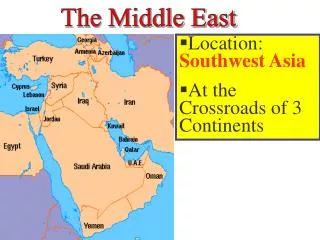
Energy Status in the Middle East Countries February 1, 2005 2003 Total Generation Capacity in the ME : 154GW * Check Source of Information Slide 3
Energy Status in the Middle East Countries February 1, 2005 Average Net Electricity Consumption Growth: 2.8% / year * Source: Energy Information Administration 4
Energy Status in the Middle East Countries February 1, 2005 * Source: Energy Information Administration 5
Facts in the Middle East: • Saudi Arabia has 25% of proven oil reserve, UAE • 10%, Kuwait 8%. • - 2004 KSA oil exports revenues > 100 billion $ • - 2001: ME produced 32% of crude oil world production • The largest reserve of natural gas is in ME: 3rd in • Qatar, 5th in UAE: • ME holds 35% of world’s estimated reserve in gas • 2004 GDP Growth: UAE: 4%, Bahrain/Jordan: 4.6%, • Qatar: 4.7%, KSA: 6.1%. • Dubai: the Model of the New 21st Century City: • Internet City, Children’s City, Festivity City, Knowledge Village Energy Status in the Middle East Countries February 1, 2005 6
Maturity of Various Business Lines Economic / Industrial Boom Population Growth Energy Status in the Middle East Countries February 1, 2005 Great Potential Business Market Area 7
Energy Status in the Middle East Countries February 1, 2005 • HOWEVER… • Electricity Prices differs from lowest prices (Qatar, • Saudi, UAE, Syria) to the highest prices in the • world (Lebanon, Jordan) • - Losses are stamped by non-technical losses like • electricity theft that may reach 24% of production • Electricity Demand may exceed sometimes • electricity supply leading some ME countries to • import electricity from neighbors to avoid • black-out • - Many ME Power Sectors are State-Owned: No competition. * Check Source of Information Slide 8
Energy Status in the Middle East Countries February 1, 2005 Quality of Service not matching Quality of Life High Rate of Non-Technical Losses Operation Deficiency Great Potential for Customer Services Improvement 9
Transformations in Middle East Power Sector: • Qatar: 2000: Privatization: Asset of MEW → QEWC • 2001: Ras Laffan IWPP • Bahrain: In 2004: First contract for IPP / Consideration • of Privatization of entire electricity sector • UAE: In 1998: ADWED → ADWEA / 2nd IPP in Gulf area • - Jordan: Deregulation distribution and generation • power network • In 2002, grid linking project: Egypt, Jordan, Syria and • others Energy Status in the Middle East Countries February 1, 2005 10
Technologies Adoptedin the Middle East Countries National Control Center LV AMR Pilot Project National Control Center Trends Automation Projects (EMS/DMS) AMR Pilot Projects/Contract Signature February 1, 2005 BAHRAIN Serious Efforts in ME were put to manage the HV Level. Why not the MV and LV Device ? 11
Today Utility Objectives February 1, 2005 Generation Level Black-outs Continuous Supply Transmission Level Classic network Responsive, Intelligent Network Distribution Level Historical information Real-time Information Consumer Level Non-technical losses Immediate Actions Required Manual / lengthy collection Automated / Remote 12
Today Utility Objectives February 1, 2005 Generation Level Black-outs Continuous Supply Transmission Level Classic network Responsive, Intelligent Network Distribution Level Historical information Real-time Information Consumer Level Fraud unidentified Immediate Identification Manual / lengthy collection Automated / Remote 13
CONTROL CENTER - SCADA Substation SCADA Substation SCADA Substation SCADA ? ? ? ? ? February 1, 2005 Automation Status in the ME Network Automation Distribution Automation Customer Automation 14
NEEDS Master PLAN “Enterprise Utility System” Enterprise Utility System February 1, 2005 DMS Improved operation, Quality of service, Productivity improvement EMS Secure Operation, Quality of Supply, System Efficiency GIS Network Mapping, Data Management, Utility Business Activities Automation: Automatic Meter Reading LOAD Management Distribution Automation Substation Automation MIS Developed policy setting, cost/benefit analysis and work flow procedure WIS Warehouse Control, Minimum Stock Monitoring, Purchasing Control CIS Enhanced energy tracking, data analysis, and customerrelation 15
Digital Modeling of a Utility Technical Flow Fuel Generation Transmission Distribution NM NM NM DM CM Financial Flow Financial Flow Monitoring control & reliability of supply Flow measurements & control settings Billing & collection management systems Consumption Water, and Electricity 79 KWh 3 Phase February 1, 2005 Technical and non-technical losses METERING THROUGHOUT THE NETWORK IS THE CHALLENGE 16
Generation Level i Black-outs i Continuous Supply i Transmission Level Classic network i Responsive, Intelligent Network Distribution Level Historical information i i Real-time Information i Fraud unidentified Immediate Identification Consumer Level i i Manual / lengthy collection Automated / Remote February 1, 2005 AMR Transforms the Utility 17
i i ENERGY i i TRACKING i i i i i February 1, 2005 AMR Transforms the Utility UTILITY BENEFIT: Cost Minimization of Customer Management Course of Action 18
i i ENERGY i i TRACKING i i i i i February 1, 2005 AMR Transforms the Utility CUSTOMER BENEFIT: Customized Tariffs & Value Added Services 19
Bill $ Bill $ Bill $ Bills Collected Bills Issued Bills Consumed Energy Distributed Bills Issued Energy Consumed Bills Collected Energy Distributed Bills Collected Bills Issued Enhancing Reading Efficiency Improving Overall Efficiency Increasing Collection Efficiency February 1, 2005 Transactions Efficiency 20
ENERGY Financial Flow Technical Flow TRACKING February 1, 2005 Supply – Demand Balance i i i i i i i i i i i i i i i 21
No Enterprise System System Not Open No Integration Energy / Load Tracking Resources Management Cost Optimization Load Management February 1, 2005 AMR: The Business Driven Approach Automatic Meter Reading Technology 22
AMR Implementation Bottleneck in ME Countries February 1, 2005 Investments Risks Fear of Unrecoverable Cost Regulatory Uncertainties Solution Driven by Product Uncertainty to Capture Value Absence of Awareness IMPLEMENTATION BOTTLENECKS Lack of Enterprise Perspective System Not Open Lack of Standards Immaturity of Digital Utility Concept 23
Changing or Upgrading • Meters • - Meeting Dynamic Growth • - Financing Strategies • Elaboration • - Benefit/Cost Payback Analysis • - Decision Support • - Strategic Planning • Development • Portfolio Creation • Dynamic Rate Structure More Expertise & Dedicated Consultancy Services February 1, 2005 AMR : How to Move Ahead? More Understandings of Utility’s / Customer’s Needs & Expectations More Awareness • Involvement of Regional Role • Understanding Implementation • Constraints • Building Internal Capabilities • Use of Advanced Technologies 24
Vendors Pre-Qualification Bid Evaluation Technical Specification Request for Proposal Preparation Contract Negotiation Feasibility Study System Development and Testing Meters Installation February 1, 2005 Turnkey AMR System Project 25
S Minimum 2.5 Million February 1, 2005 AMR Potential AMR 4-6% LOSSES 8-25% LOSSES Well Structured Network Current Networks Because only 1% LOSSES in 1GW Current Networks 26
February 1, 2005 AMR Potential 27
February 1, 2005 AMR Potential 28
Dubai Electricity and Water Authority (DEWA) Abu Dhabi Electricity and Water Authority (ADWEA) Energy Information Administration The World Bank The United Nations Stats The Saudi Arabia Information Resource Emiri Diwan - Qatar February 1, 2005 Source of Information
THANK YOU For More Reference: Paper ‘Transforming the Utility Business Environment’ / Metering International / Issue4 Contact Address: info@needs.com.lb