Download
1 / 20
210 likes | 443 Views
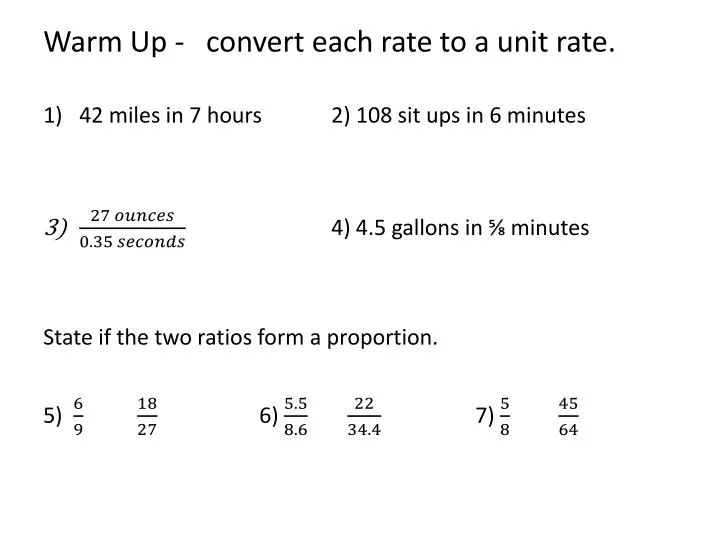
Warm Up - convert each rate to a unit rate. 42 miles in 7 hours 2) 108 sit ups in 6 minutes 4) 4.5 gallons in ⅝ minutes State if the two ratios form a proportion. 5) 6) 7) . Homework questions.

E N D
Warm Up - convert each rate to a unit rate. • 42 miles in 7 hours 2) 108 sit ups in 6 minutes • 4) 4.5 gallons in ⅝ minutes State if the two ratios form a proportion. 5) 6) 7)
Learning ObjectiveStudents will learn how to interpret tables and graph proportional ratios.CCSS: CCSS: 7.RP.2
You can determine if a relationship is proportional by looking at a table of values or the graph. How? Table If all the ratios of numbers in the table are equivalent, the relationship is proportional. Graph If the graph of the numbers forms a straight line through the origin (0,0), the relationship is proportional.
Example 1. On a field trip, every chaperone is assigned 12 students. Is the student to chaperone ratio proportional? If you use a table to demonstrate, you would need several ratios to start. Next, find the simplified ratios and compare them. Are they the same? The relationship is proportional.
Example 2 Try this: The local pizza place sells a plain pie for $10. Each topping costs an additional $1.50. Is the cost of pizza proportional to the number of toppings purchased? cost toppings Ratios: Since the ratios are not equivalent, the relationship is not proportional.
Ex 3) Is the relationship shown in the table proportional? Yes No
Remember: Table If all the ratios of numbers in the table are equivalent, the relationship is proportional. Graph If the graph of the numbers forms a straight line through the origin (0,0), the relationship is proportional.
Example 8. On a field trip, every chaperone is assigned 12 students. Is the student to chaperone ratio proportional? (x) (y) Connected points form a straight line 60 54 Students 48 42 36 Line crosses through the origin 30 24 18 Since the graph is a straight line through the origin, the relationship is proportional. 12 6 0 1 2 3 4 5 6 7 8 9 10 Chaperones
Example 9. Draw a graph to represent the relationship. Is the relationship proportional? 10 9 8 7 6 5 4 3 2 1 0 1 2 3 4 5 6 7 8 9 10
Is the relationship shown in the graph proportional? 10 50 Yes 45 No 40 Salary ($) 35 30 25 20 15 10 5 0 1 2 3 4 5 6 7 8 9 10 Hours
Is the relationship shown in the graph proportional? 11. Yes No 50 45 Cost ($) 40 35 30 25 20 15 10 5 0 1 2 3 4 5 6 7 8 9 10 Toppings
The constant of proportionality is a constant ratio (unit rate) in any proportional relationship. We use the letter k to represent the constant of proportionality. Equations: y = kx or k = y x “x” is your independent variable “y” is your dependent variable “y” will depend on what you do to “x”. Whatever you do to “y over x” you will get k the constant. Unit rate is the relationship between the y and the x. When the x value is 1, y will be the unit rate.
We can find the constant of proportionality from a table of values, equation and a graph. In a table, simplify any one of the ratios. (x) (y)
Ex 14) Find the constant of proportionality: (x) (y) Click
In an equation, what does k equal. Example 18: Click Click Click
In a graph, choose a point (x, y) to find and simplify the ratio. (2, 24) Find the unit rate. 60 54 48 42 Students 36 30 24 18 12 6 0 1 2 3 4 5 6 7 8 9 10 Chaperones
Learning ObjectiveCan you interpret tables and graph proportional ratios?If not, please schedule a math clinic session!CCSS: CCSS: 7.RP.2
Homework Worksheet: Representing Proportional Relations Quiz 7-1, 7-2 & Proportional Relationships