Download

1 / 29
360 likes | 1.05k Views
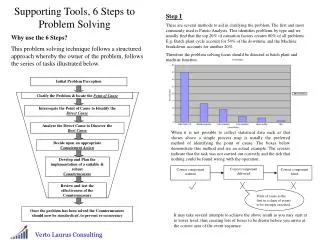
Problem Solving Tools. INSY 3021 Auburn University Spring 2008. Exploratory Tools. Pareto Analysis Fish Diagrams Gantt Chart PERT Chart Job / Worksite Analysis Guide. Pareto Analysis.

E N D
Problem Solving Tools INSY 3021 Auburn University Spring 2008
Exploratory Tools • Pareto Analysis • Fish Diagrams • Gantt Chart • PERT Chart • Job / Worksite Analysis Guide
Pareto Analysis • Items identified and ordered on common scale in decreasing frequency, creating a cumulative distribution • 80/20 Rule: 20% of the items account for 80% of the problems • Allows the company to concentrate resources on the jobs with the most problems
Pareto Analysis • Example DiagramFigure 2-2
Fish-bone Diagrams • Cause-and-effect diagrams • Identified problem or undesirable result is the “head” • Contributing factors are the “bones” • Typical categories include: Human, machine, methods, materials, environment, and administrative • Estimates associated probabilities
Fish-bone Diagrams • Example DiagramFigure 2-3
Gantt Chart • Used for planning of complex projects • Shows expected start and completion times, also duration of events • Similarly, major events can be broken into smaller sub-tasks • Shade the bars to show actual completion time
Gantt Chart • Example DiagramFigure 2-4
PERT Chart • Program Evaluation and Review Technique (PERT) is a planning and control tool • Also known as Network Diagram or Critical Path • Graphically portrays the optimum way to obtain a desired objective with respects to time • Optimistic, average, and pessimistic time estimates utilized
PERT Chart • Example DiagramFigure 2-5
Job/Worksite Analysis Guide • Perform a walkthrough observing the area, worker, task, environment, administrative constraints, etc… • Develop an overall perspective of the situation • Particularly useful in workstation redesign
Job/Worksite Analysis Guide • Example GuideFigure 2-6
Recording and Analysis Tools • Operation Process Chart • Flow Process Chart • Flow Diagram • Worker and Machine Process Charts • Gang Process Charts
Operation Process Chart • Chronological sequence of all operations, inspections, time allowances, materials • Depicts entrance and exit of all components and sub-assemblies and products • Provides information on the number of employees required time for jobs and inspections
Operation Process Chart • Example DiagramFigure 2-8
Flow Process Chart • More detailed, fit for closer observation of smaller components or assemblies • Shows all moves (distances) and storage delays (times) for product movement in plant • Aids in the reduction of hidden costs, “Muda.” • Can be beneficial for plant layout suggestions
Flow Process Chart • Example DiagramFigure 2-11
Flow Diagram • Pictorial representation of the layout of the plant • Good supplement to the Flow Process Chart
Flow Diagram • Example DiagramFigure 2-13
Worker and Machine Process Charts • Used to study, analyze, and improve one workstation • Shows the time relationship between working cycle of the person and the operating cycle of the machine • Reveals idle time for both machines and workers • Establishes “TAKT” time
Worker and Machine Process Charts • Example DiagramFigure 2-15
Gang Process Chart • Example DiagramFigure 2-16
Quantitative Tools • Synchronous Servicing • Random Servicing • Line Balancing
Synchronous Servicing • Assigning more than one machine to an operator
Random Servicing • Helps to determine the number of machines to assign to an operator when it is not known exactly when each machine needs to be serviced or for how long
Line Balancing • Helps to determine the ideal number of workers to be assigned to a production line • Computer software is available to eliminate the calculations