Download
1 / 31
310 likes | 321 Views
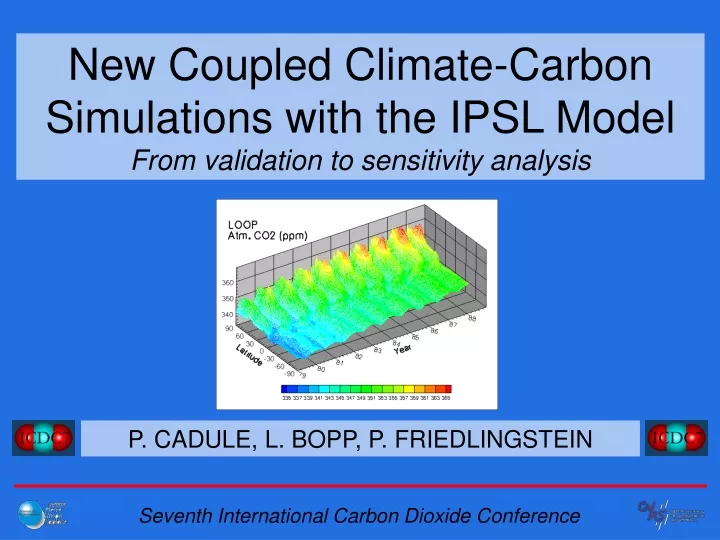
New Coupled Climate-Carbon Simulations with the IPSL Model From validation to sensitivity analysis. P. CADULE, L. BOPP, P. FRIEDLINGSTEIN. Seventh International Carbon Dioxide Conference. Carbon Models Offline Responses.

E N D
New Coupled Climate-Carbon Simulations with the IPSL ModelFrom validation to sensitivity analysis P. CADULE, L. BOPP, P. FRIEDLINGSTEIN Seventh International Carbon Dioxide Conference
Carbon Models Offline Responses Either weaker sinks or sources according to future projections with identical IPCC CO2 and Climate scenarii [IPCC TAR, 2001]
Atm. [CO2] Carbon Models Online Responses All models have a positive feedback but … Large panel of possible responses due to a wide range of climate and carbon models sensitivities Δ[CO2]max= 224 ppm Δ[CO2]min = 19 ppm [C4MIP- Friedlingstein et al., 2005]
Climate Atmospheric [CO2] AtmosphereLMDZ4 OceanORCA-LIMOPA 8.2 Coupler OASIS 2.4 ∆t = physic time step ∆t = 1day CO2 concentrationre-calculated each month MarineBiochemistry PISCES Terrestrial biosphereORCHIDEE(STOMATE activated) Carbon Land flux GtC/mth Ocean flux GtC/mth EMI = external forcing [Marland et al, 2005 Houghton, 2002] Net total carbon flux Fluxland + Fluxocean A New Carbon Climate Coupled Model
Fossil emi. Climate Land and Ocean LOOP01 LOOP03 LOOP02 LOOP03 Highlights CO2 change impact on fluxes Highlights climate change impact on fluxes A New Carbon Climate Coupled Model • LOOP02 : fully coupled, emissions • Climate aware of CO2 increase • LOOP03 : decoupled, emissions • Climate agnostic to CO2 increasefix atmospheric CO2 concentration[CO2] = 286.2 ppm LOOP02 CO2 Climate feedback Geochemical impact LOOP03 Climate impact
Simulated CO2 Concentration [CO2] is re-calculated each month based on : • fossil fuel and land-use emissions • net CO2 fluxes computed by ORCHIDEE (land) and PISCES (ocean) positive feedback : 8 ppm in 2040 LOOP2 vs LOOP3 Weaker land and oceanic uptakes in coupled run (LOOP2)
Outline • Confront results to observations • Budgets • Seasonal Cycle • IAV • Long term trends • Better understand processes individually • Sensitivity experiments (e.g. Ocean Processes)
Carbon Dioxide Concentration Simulation matches historical data… [CDIAC, 2005] Is it enough to be confident in the model projections ?
fossil fuel Atmospheric carbon variation land Land use ocean Global Budgets : 80s and 90s - 2,8 GtC/yr - 2,6 GtC/yr - 2,2 GtC/yr - 1.8 GtC/yr Good agreement between LOOP and IPCC
Regional Budgets : 1988-2003 Need to confront models results to inversions data Over-estimation in thetropical region for the continental biosphere
Regional Breakdown : 1988-2003 N. Atl and N. Pacshould be different 22 emission regions and 78 CO2 measurements locations [Baker et al., 2005]
Seasonal Cycle at Mauna Loa A realistic seasonal cycleat a CO2 measurement location Obs. Model
Inter-Annual Variability of CO2 Fluxes [Baker et al., 2005] Over estimation of IAV in Land Under estimation of IAV in Ocean Land and ocean inter-annual variability [PgC yr-1]
Long Term Trends : The Ocean LOOP GLODAP Atlantic Pacific 96.5 PgC (1860-1995) 106 ± 17 PgC (1800-1994) CO2 Anthropogenic micromol/kg [GLODAP, Sabine et al., 2004]
Outline • Confront results to observations • Budgets • Seasonal Cycle • IAV • Long term trends • Better understand processes individually • Sensitivity experiments (e.g. Ocean Processes)
Sensitivity Experiments on Ocean Uptake Offline simulations to determine sensitivity to climate change 1 x CO2 Atmospheric pCO2 (ppm) 4 x CO2 Oceanic sink in coupled run is weaker at 4 x CO2 Global Temperature (°C) Ocean Uptake (GtC / yr) Geochemical + Climatic Effects Geochemical Effect
Depth Depth Only Impact on the natural C-Cycle -25 GtC All effects - 80GtC Climate Impact on the marine C-Cycle Ocean stratification prevents anth. CO2 penetration. Years
Continental biosphere and oceans sinks are influenced by CO2 increase and by climate change. • Obvious need to model Carbon Cycle- Climate interactions. • Wide range of possible response drives the need for a better understanding of involved processes. • Observations and inversions both at global and breakdown region scale constitute the best common reference • Identify and implement, in the models, human dependent processes (e.g. land-use) that play an important role in the carbon cycle.
Thank You ! With the contribution ofRachid BENSHILA, Patrick BROCKMANN, Philippe BOUSQUET, Arnaud CAUBEL, Sébastien DENVIL, Jean-Louis DUFRESNE, Laurent FAIRHEAD, Marie-Angèle FILIBERTI, Corinne LEQUERE, Cyril MOULIN, Philippe PEYLIN, Peter RAYNER
NAME Occupation e-mail Rachid BENSHILA Ocean modelling Engineer Rachid.Benshila@lodyc.jussieu.f Patrick BROCKMANN Visualisation software Engineer Patrick.Brockmann@cea.fr Philippe BOUSQUET CO2 transport Philippe.Bousquet@cea.fr Arnaud CAUBEL Software Engineer - coupling aspects Arnaud.Caubel@cea.fr Sébastien DENVIL Climate modelling and global change simulations Engineer Sebastien.Denvil@ipsl.jussieu.fr Jean-Louis DUFRESNE Climate modelling JeanLouis.Dufresne@lmd.jussieu.fr Laurent FAIRHEAD Atmospheric modelling Engineer Laurent.Fairhead@lmd.jussieu.fr Marie-Angèle FILIBERTI Atmospheric Tracer transport Engineer filiberti@ipsl.jussieu.fr Philippe PEYLIN CO2 transport and Inversion Philippe.Peylin@cea.fr Peter RAYNER CO2 Inversion Peter.Rayner@cea.fr
References Aumont, O., E. Maier-Reimer, S. Blain, and P. Monfray (2003), An ecosystem model of the global ocean including Fe, Si, P co-limitations, Glob. Biogeochem. Cycles. 17(2), 1060, 10.1029/2001GB00174.Baker D. F.( 2005), submitted to GBCBopp L., (2001), Changements Climatiques et Biogéochimie Marine : Modélisation du dernier Maximum Gliaciaire et de l’Ere IndustrielleBousquet P., Peylin P., Ciais P., Le Quéré C., Friedlingstein P., Tans P.P., (2000). Regional changes in carbon dioxide fluxes of land and oceans since 1980. Science 290, 1342-1345.Cox, P.M., R. A. Betts, C. D. Jones, S. A. Spall, and I. J. Totterdell (2000), Acceleration of global warming due to carbon-cycle feedbacks in a coupled climate model, Nature, 408, 184-187.Dufresne, J.-L., P. Friedlingstein, M. Berthelot, L. Bopp, P. Ciais, L. Fairhead, H. LeTreut, and P. Monfray (2002), Effects of climate change due to CO2 increase on land and ocean carbon uptake. Geophys. Res. Lett., 29(10), 10.1029/2001GL013777Friedlingstein P., Dufresne J.L., Cox P.M., Rayner P., (2003) How positive is the feedback batween climate change and the carbon cycle ?. Tellus 55B, 692-700Friedlingstein P., P. Cox, R. Betts, L. Bopp, W. von Bloh, V. Brovkin, S. Doney, M. Eby, I. Fung, B. Govindasamy, J. John, C. Jones, F. Joos, T. Kato, M. Kawamiya, W. Knorr, K. Lindsay, H. D. Matthews, T. Raddatz, P. Rayner, C. Reick, E. Roeckner, K.-G. Scnitzler, R. Schnur, K. Strassmann, A. J. Weaver, C. Yoshikawa, and N. Zeng (2005), Climate –carbon cycle feedback analysis, results from C4MIP model intercomparaison (Submitted to Journal of Climate)Houghton, R.A., and J.L. Hackler (2002), Carbon Flux to the Atmosphere from Land-Use Changes. In Trends: A Compendium of Data on Global Change. Carbon Dioxide Information Analysis Center, Oak Ridge National Laboratory, U.S. Department of Energy, Oak Ridge, Tenn., U.S.A.Houghton, J.T., Y. Ding, D.J. Griggs, M. Noguer, P.J. van der Linden, X. Dai, K. Maskell, and C.A. Johnson (2001), Climate Change 2001: The Scientific Basis. Contribution of Working Group I to the Third Assessment Report of the Intergovernmental Panel on Climate Change, Cambridge University Press, Cambridge, United Kingdom and New York, NY, USA.
Krinner G., Nicolas Viovy, N. de Noblet-Ducoudré, J. Ogée, J. Polcher, P. Friedlingstein, P. Ciais, S. Sitch, and I. C. Prentice (2005), A dynamic global vegetation model for studies of the coupled atmosphere-biosphere system, Global Biogeochem. Cycles, 19, GB1015, doi:10.1029/2003/GB002199 LE QUÉRÉ, C., AUMONT, O., BOPP, L., BOUSQUET, P., CIAIS, P., FRANCEY, R., HEIMANN, M., KEELING, C. D., KEELING, R. F., KHESHGI, H., PEYLIN, P., PIPER, S. C., PRENTICE, I. C. & RAYNER, P. J. (2003), Two decades of ocean CO2 sink and variability., Tellus B 55 (2), 649-656.doi: 10.1034/j.1600-0889.2003.00043.xMarland, G., T.A. Boden, and R. J. Andres (2005), Global, Regional, and National CO2 Emissions. In Trends: A Compendium of Data on Global Change. Carbon Dioxide Information Analysis Center, Oak Ridge National Laboratory, U.S. Department of Energy, Oak Ridge, Tenn., U.S.A.Marti, O., P. Braconnot, J. Bellier, R. Benshila, S. Bony, P. Brockmann, P. Cadule, A. Caubel, S. Denvil, J. L. Dufresne, L. Fairhead, M. A. Filiberti, M.-A. Foujols, T. Fichefet, P. Friedlingstein, H. Goosse, J. Y. Grandpeix, F. Hourdin, G. Krinner, C. Lévy, G. Madec, I. Musat, N. deNoblet, J. Polcher, and C. Talandier (2005), The new IPSL climate system model: IPSL-CM4. Note du Pôle de Modélisation, 26, ISSN 1288-1619.Peylin P., Baker D., Sarmiento G., Ciais P., Bousquet P., (2002), Influence of transport uncertainty on annual mean and seasonal inversions of atmospheric CO2. J. Geophys. Res. 107(D19), 4385, 10.1029/2001JD000857.Sabine Christopher L., Richard A. Feely, Nicolas Gruber, Robert M. Key, Kitack Lee, John L. Bullister, Rik Wanninkhof, C. S. Wong, Douglas W. R. Wallace, Bronte Tilbrook, Frank J. Millero, Tsung-Hung Peng, Alexander Kozyr, Tsueno Ono, and Aida F. Rios (2004) , The Oceanic Sink for Anthropogenic CO2, Science ; 305: 367-371 [DOI: 10.1126/science.1097403]Takahashi, T., Sutherland, S. C., Sweeney, C., Poisson, A., Metzl, N. and co-authors, (2002). Global sea-air CO2 flux based on climatological surface ocean pCO2, and seasonal biological and temperature effects. Deep Sea Res. II 49, 1601-1622Data sets :Historical CO2 concentration : http://www.cnrm.meteo.fr/ensembles/public/data/CO2_fit.txtMODIS : http://cybele.bu.edu/modismisr/products/modis/modislaifpar.htmlSeaWIFS : http://oceancolor.gsfc.nasa.gov/SeaWiFS/
“ En résumé ” • The need for Carbon-Climate Coupling • Modeling the carbon cycle • Coupling it with the climate • But now essentially • Better understand processes individually • Confront results to observations Pushing towards convergence of processes and their responses
ocean sensitivity to T° ocean sensitivity to [CO2] climate sensitivity land sensitivity to [CO2] land sensitivity to T° Climate and Carbon Models Sensitivity LOOP vs C4MIP models LOOP is inside C4MIP responses range. But is it a sufficient criterion ? [C4MIP- Friedlingstein et al., 2005]
Climate Change and Carbon Cycle Interactions Wide range of climate and carbon models sensitivity ocean sensitivity to [CO2] ocean sensitivity to T° climate sensitivity land sensitivity to [CO2] land sensitivity to T° [C4MIP-Friedlingstein et al., 2005]
Simulated CO2 Fluxes ORCHIDEE PISCES
TerrestrialBiosphereModel : ORCHIDEE [Krinner, 2005]
PO43- Diatoms NH4+ Si Nano-phyto NO3- Iron MicroZoo D.O.M Meso Zoo P.O.M Small Ones Big Ones Oceanic Biogeochemical Model PISCES Marine biology is highly influenced by the ocean dynamic motivating the need of both PISCES and OPA [Aumont, 2001; Aumont 2003]
Sensitivity Analysis Sensitivity of ocean carbon models to climate change Reduction of carbon quantity entering the ocean shows a large range amongst the models min = - 14 GtC/°C max = - 60 GtC/°C year So, what does influence the ocean response to the climate ?