Download
1 / 38
490 likes | 1.15k Views
Trade Areas and Retail Site Selection. Chapters 8 & 9. Location, Location, Location!!!. Importance of location decision: Requires complex decision making Costs lots of $$ Little flexibility once a location has been chosen

E N D
Trade Areas and Retail Site Selection Chapters 8 & 9
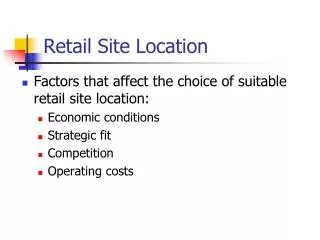
Location, Location, Location!!! • Importance of location decision: • Requires complex decision making • Costs lots of $$ • Little flexibility once a location has been chosen • Attributes of location have a strong impact on the retailer’s strategy
Size & characteristics of population Level of competition Access to transportation Availability of parking Attributes of nearby stores Property costs Length of agreement (if lease) Population trends Legal restrictions Criteria to be considered:
Site Evaluation • Accessibility • Locational advantages • Terms of occupancy • Legal considerations (e.g. environmental considerations, zoning restrictions, building codes, signs, licensing requirements)
Checklist for Site Evaluations • Local Demographics • Population and/or household base • Population growth potential • Lifestyles of consumers • Income potential • Age makeup • Population of nearby special markets, • that is, daytime workers, students, • and tourists, if applicable • Occupation mix
Checklist for Site Evaluations • Traffic Flow and Accessibility • Number and type of vehicles passing location • Access of vehicles to location • Number and type of pedestrians passing • location • Availability of mass transit, if applicable • Accessibility of major highway artery • Quality of access streets • Level of street congestion • Presence of physical barriers that affect • trade area shape
Checklist for Site Evaluations • Retail Competition • Number and types of stores in area • Analysis of “key” players in general area • Competitiveness of other merchants • Number and location of direct competitors • in area • Possibility of joint promotions with local • merchants
Checklist for Site Evaluations • Site Characteristic • Number of parking spaces available • Distance of parking areas • Ease of access for delivery • Visibility of site from street • History of the site • Compatibility of neighboring stores • Size and shape of lot • Condition of existing building • Ease of entrance and exit for traffic • Ease of access for handicapped customers • Restrictions on sign usage • Building safety code restrictions • Type of zoning
Checklist for Site Evaluations • Cost Factors • Terms of lease/rent agreement • Basic rent payments • Length of lease • Local taxes • Operations and maintenance cost • Restrictive clauses in lease • Membership in local merchants • association required • Voluntary regulations by local merchants
Site Selection • Trade area -- contiguous geographic area that accounts for the majority of a store’s sales and customers • Primary trade zone -- Usually 3-5 mile radius; generates 60-65% of customers • Secondary trade zone -- Usually 3-7 mile radius; generates 20% of customers • Tertiary trade zone -- Usually 15 - 50 mile radius
Steps in selecting a site: • Evaluate alternative geographic areas in terms of the characteristics of residents and existing retailers (trading-area analysis) • Determine whether to locate as stand-alone, unplanned business district or planned shopping center • Make a decision about location type • Analyze alternate sites
Retailer Formats for Accessing Your Target Market Retail Formats Store-Based Nonstore-Based Business District Shopping Centers/Malls Freestanding Nontraditional Street Peddling Mail-Order Automated Merchandising Systems Direct Selling Interactive TV Internet
Types of Leases • Percentage • Fixed - Rate • Percentage leases - rent is based on a percentage of sales. • Retailers also typically pay a maintenance fee based on a percentage of their square footage of leased space. • Most malls use some form of percentage lease.
Variations of Percentage Leases • Percentage lease with specified maximum - percentage of sales up to a maximum amount. • Rewards retailer performance by allowing retailer to hold rent constant above a certain level of sales • Percentage lease with specified minimum - retailer must pay a minimum rent no matter how low sales are. • Sliding scale - percentage of sales as rent decreases as sales go up.
Fixed Rate Leases • Fixed rate leases - used by community and neighborhood centers. • Retailer pays a fixed amount per month over the life of the lease. • Not as popular as percentage leases • Graduated lease - a variation of the fixed rate lease • Rent increases by a fixed amount over a specified period of time.
Percentage or Fixed Rate Leases • Maintenance-increase-recoupment lease - used with either a percentage or fixed rate lease. • Rent increases if insurance, property taxes, or utility bills increase beyond a certain point. • Net lease - retailer is responsible for all maintenance and utilities.
Prohibited Use Clause • Limits the landlord from leasing to certain tenants • Some tenants take up parking spaces and don’t • bring in shoppers: bowling alley, skating rink, meeting hall, dentist, or real estate office. • Some tenants could harm the shopping center’s • wholesome image: bars, pool halls, game parlors, off-track betting establishments, massage parlors and pornography retailers.
Exclusive Use Clause • Prohibits the landlord from leasing to retailers • selling competing merchandise • Specify no outparcels • Specify if certain retailer leaves center, they can • terminate lease. • Escape clause • Allows the retailer to terminate its lease if sales don’t reach a certain level after a specified number of years, or if a specific co-tenant in the center terminates its lease.
EnvironmentalIssues “Above-ground” risks - such as asbestos-containing materials or lead pipes used in construction. Hazardous materials - e.g. dry cleaning chemicals, motor oil, that have been stored in the ground. • Retailers’ Protection • Stipulate in the lease that the lessor is responsible for removal and disposal of this material if it’s found. • Retailer can buy insurance that specifically protects it from these risks.
Other Legal Issues • Zoning and Building Codes • Zoning determines how a particular site can be used. • Building codes determine the type of building, signs, size, type of parking lot, etc. that can be used • Signs • Restrictions on the use of signs can also impact a particular site’s desirability • Licensing Requirements • Some areas may restrict or require a license for alcoholic beverages
Retail Trading Area Identification • Spotting Techniques: “spot” customer origins • license plate surveys • customer surveys • customer records • customer activities (contests, sweepstakes) • Demographic data & GIS Vendors • Census • Buying Power Index (BPI) • Measuring Competition
Demographic Data and GIS Vendors • Demographic data vendors specialize in repackaging and updating census-type data. • Geographic Information System (GIS) is a computer system that enables analysts to visualize information about their customers’ demographics, buying behavior, and other data in a map format. • GIS is a spatial database that stores the location and shape of information. • Analysts can identify the boundaries of a trade area and isolate target customer groups
GIS Components Physical Geography Latitude/Longitude Land/Water Terrain Rainfall/Snow Temperature Cultural Geography Demographics Man-Made Structures Consumption Patterns Work Patterns Leisure Behavior Deviant Behavior Data Inputs GIS (Data Aggregation and Analysis via Computer) Output Maps and Other Displays of Information
Retail Location Theories 1. Retail Gravity Theory 2. Saturation Theory 3. Buying Power Index
Retail Location Theories Retail gravity theory suggests that there are underlying consistencies in shopping behavior that yield to mathematical analysis and prediction based on the notion or concept of gravity.
Huff’s Gravity Model Based on the premise that the probability that a given customer will shop in a particular store or shopping center becomes larger as the size of store or center grows and distance or travel time from customer shrinks
Huff’s Law • Assumptions: • The proportion of consumers patronizing a given shopping area varies with the distance from the shopping area • The proportion of consumers patronizing various shopping areas varies with the breadth and depth of merchandise offered by each shopping area • The distance that consumers travel to various shopping areas varies for different types of products purchased • The “pull” of any given shopping area is influenced by the proximity of competing shopping areas
Huff’s Model: The Solution • Pij= 1000 32 • (1000 32) + (500 52) + (100 12) • Probability = .43 • .43 x 12,000 students = 5,160 customers • 5,160 customers x $150 = $774,000 • Repeat steps 1 to 3 for the remaining areas and then sum them.
Retail Location Theories Saturation theory examines how the demand for goods and services of a potential trading area is being served by current retail establishments in comparison with other potential markets.
Retail Location Theories Index of retail saturation (IRS) is the ratio of demand for a product (households in the geographic area multiplied by annual retail expenditures for a particular line of trade per household) divided by available supply (the square footage of retail facilities of a particular line of trade in a geographic area).
Retail Location Theories Index of Retail Saturation (IRS) where IRS is the index of retail saturation H is the number of households in the area RE is the annual retail expenditures for a particular line of trade per household in the area RF is the square footage of retail facilities of a particular line of trade in the area (including square footage of the proposed store) IRS = (H X RE)/RF
Retail Location Theories Buying power index (BPI) is an indicator of a market’s overall retail potential and is composed of the weighted measures of effective buying income (personal income, including all nontax payments such as social security, minus all taxes), retail sales, and population size.
Buying Power Index (BPI) • Published annually in Demographics USA • Measures a given market’s ability to buy • Is expressed as a percentage of the total U.S. potential Source: The Census and You, U.S. Department of Commerce, Bureau of the Census.
Retail Location Theories Buying Power Index BPI = 0.5(the area’s percentage of U.S. effective buying income) + 0.3(the area’s percentage of U.S. retail sales) + 0.2(the area’s percentage of U.S. population)
Buying Power • Web sites for additional information • http://www.selig.uga.edu/forecast/totalbuy/total/tbp1.html • http://www.repgroup.com/bpi.htm • http://www.census.gov/epcd/www/97EC44.HTM • http://demographicsusa.com/p_demographics.html • Other • http://www.mlb.ilstu.edu/ressubj/subject/business/home.htm
Identifying Communities with High Demand Potential for Fast-Food Drive-In Restaurant Demographic Desired Target Characteristic Market Community A Community B Population per over 400 375 423 Square Mile Median Family Income over $31,000 $28,024 $32,418 % Population 14-54 over 60% 48% 63% % White Collar over 50% 38% 54% % People Living in 1-3 over 70% 61% 72% Person Units % Workforce Traveling over 75% 49% 74% 0-14 Minutes to Work Average Annual over $600 $521 $619 Household Expenditure on Eating Out