Download
1 / 9
100 likes | 220 Views
L-band Microwave Emission of the Biosphere (L-MEB). Objectives. To perform the validation on the capabilities of the participating land surface schemes in simulating the brightness temperature in those areas where field- and aircraft-based measurements are available. L-MEB Input Variables.

E N D
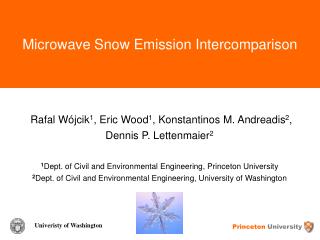
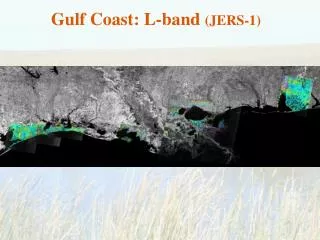
Objectives To perform the validation on the capabilities of the participating land surface schemes in simulating the brightness temperature in those areas where field- and aircraft-based measurements are available.
L-MEB Input Variables Variable Description Unit Landmask Sand% Clay% Elevation Vegetation type - - - m - Air temperature (2m) Leaf Area Index (LAI) Surface soil temperature (0 ~ 5cm) Deep soil temperature (50 or 100cm) Vegetation canopy temperature Surface soil moisture Surface frozen soil moisture Canopy water interception Snow temperature Snow depth Snow water equivalent Snow covered fraction Liquid water content of the snow K m2m-2 K K K m3m-3 m3m-3 kgm-2 K m kgm-2 - m3m-3
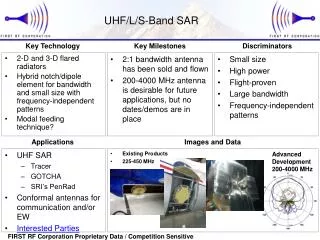
L-MEB Model Characteristics/Capabilities • Brightness temperature simulation for • Single frequency (1.4 GHz) • Dual polarization (H and V) • Multiple incidence angles • Various land cover types (and subgrid heterogeneity) • Water bodies / Bare soil / Herbaceous canopies / shrubland / forest types • A variety of climatological conditions • No snow / frozen soil / snow overlaying vegetation
Vegetation Cover Effects(- Model) • - model is based on two parameters • Optical depth () • To parameterize the vegetation attenuation properties • = bWc where Wc is the total vegetation water content. • Single scattering albedo () • To parameterize the scattering effects within the canopy - Model Parameters for Common land cover types Land cover Type Wc b 0.0 0.0 0.05 0.15 0.5*LAI 0.05 0.20 0.5*LAI 0.00 0.15 2 kgm-2 0.15 0.33 6 kgm-2 0.15 0.33 4 kgm-2 0.15 0.33 3 kgm-2 Water bodies Bare soil Crops Grasslands Shrubland Rainforests Deciduous forests Conifer forests
The direct vegetation emission (1) Soil-surface emission attenuated by the canopy (2) Downward cosmic background and atmospheric radiation attenuated by the canopy (3) The vegetation emission reflected by the soil and attenuated by the canopy (4) sensor Atmosphere (1) (2) Tsky (3) (4) v Canopy Soil - Model (con’t) Radiation Components in a Vegetation Layer
Snow overlaying herbaceous vegetation canopies (soil/vegetation/ snow/ atmosphere medium) Soil/vegetation emission (- model) Soil/vegetation emission is treated as that of the soil which is overlaid by snow (HUT model) Snow under forest /shrubland canopies (soil/snow/forest or shrubland/atmosphere medium) Soil/snow cover emission (HUT model) Soil/snow cover emission is treated as that of the soil which is overlaid by forest or shrubland canopies (- model) Snow-covered Surface(HUT Snow Model)
Other Issues • Subgrid heterogeneity • Brightness temperature of the mixed pixel is simulated as a linear combination of each cover fraction and its respective brightness temperature. • Treat soil as stratified dielectric instead of uniform dielectric. • Account for the topography effects (right now only for atmosphere). • Some improvements are necessary for the emission simulation over snow-covered surface (HUT model is an approximate approach).
Sensitivity Studies • Comparison between different models using the same forcing (baseline runs) • Comparison of different forcings on the same model. • What will produce the best results? Can we say why??