Download
1 / 36
360 likes | 430 Views
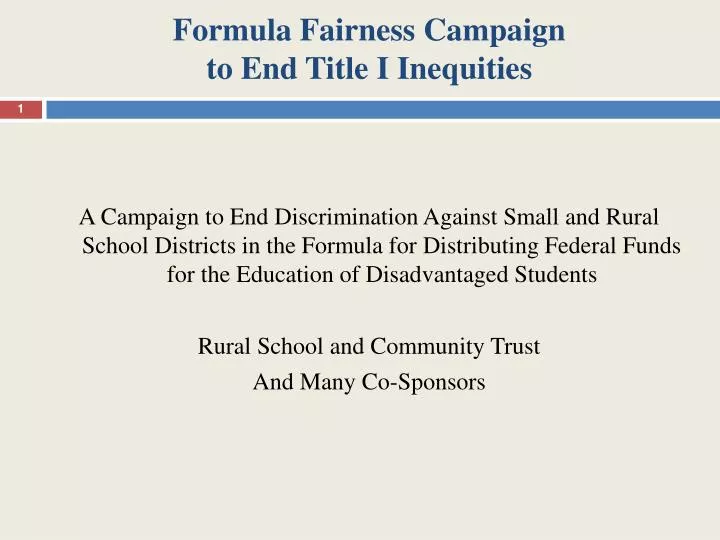
Formula Fairness Campaign to End Title I Inequities. A Campaign to End Discrimination Against Small and Rural School Districts in the Formula for Distributing Federal Funds for the Education of Disadvantaged Students Rural School and Community Trust And Many Co-Sponsors. I. Formula Basics.

E N D
Formula Fairness Campaign to End Title I Inequities A Campaign to End Discrimination Against Small and Rural School Districts in the Formula for Distributing Federal Funds for the Education of Disadvantaged Students Rural School and Community Trust And Many Co-Sponsors
I. Formula Basics It’s about share of the pie…
What is Title I? Part of Elementary and Secondary Education Act (also known as “No Child Left Behind”) Title I of the act provides federal funding to local school districts to meet the educational needs of disadvantaged students. About $14.5 billion in school year 2009-2010. “Disadvantaged” primarily means “living in poverty.”
Title I Formula : 4 in 1 There are actually four grant formulas within Title I. • Basic (unweighted) • Concentration (unweighted) • Targeted (weighted) • Education Finance Incentive (EFIG) (weighted) • Each district may be eligible for one to four of these grants. But all grants are combined into one and districts may not even be aware there are four different formulas. The funds under each grant are for identical purposes and there is only one report on use of the total funding.
Dividing the Title I Pie. • Each formula calculates the percentage of the total nationwide funding that each district is entitled to receive. • Since the total is a fixed amount appropriated by Congress, any provision in the formula that gives more to some districts, takes away from all other districts.
II. Formula Bias Counting rural out…
Number Weighting: A Key Source of Bias in the Formula When does an eligible student count more than once?
Weighting Student CountNot all disadvantaged children are counted equally. A “weighting system” artificially inflates the Title I eligible student count in most districts by counting some Title I students more than once. But a systematic bias in the weighting system favors a few very large districts by inflating their Title I student count proportionally more than it inflates the Title I student count of smaller districts. With a disproportionally larger increase in eligible student count, • the larger districts’ share of the national student count increases • while the share of all smaller districts decreases.
Weighting Used only in Targeted and EFIG Formulas Basic and Concentrated Grants– All Title I students count the same. Targeted and EFIG Grants – Student count is “weighted” in districts with higher concentrations of Title I students. Intended Purpose: Send more money to districts with high concentrations of poverty.
Result: Students in Big Districts “Count More” For example, in 2009-10, a Title I student counted as – • 2.69 students in Houston but only • 1.48 students in Jim Hogg County (TX) Despite the fact that these districts have almost identical percentages of students who are Title I eligible.
How Does the Weighting System Work? Two weighting systems are used. • Percentage Weighting – based on percentage of students in a district who are Title I eligible. • Number Weighting -- based on the numberof Title I eligible students in a district. Whichever system inflates the student count more for a district is the system used for that district in the Title I formula.
Weighting Brackets Based on Percentage of Students Who Are Title I Eligible
Weighting Brackets Based on Number of Title I Students
Both Houston and Jim Hogg County Gain “Weight.” But Houston Gains Proportionally More Weight. Jim Hogg County does better under percentage weighting -- each eligible student counts 1.48 times . 310 eligible students is inflated to 460. Houston does better under number weighting -- each eligible student counts 2.69 times . 70,947 eligible students is inflated to 191,159 students. Those are the final student counts that go into the formula for these districts. Even though Jim Hogg County “gained weight” it will suffer a decrease in Title I funding because Houston (and others) gained proportionally far more weight. Gaining a bigger Title I grant due to number weighting is not about “gaining weight.” It’s about gaining weight share.
How Much Did Your Kids Count in 2008-09? Some Examples… How Much Each If You Are In Poverty Rate Title I Student Counts Fairfax Co., VA 5.7% 1.97 Dillon 02, SC 39.2% 1.97 Wake County, NC 9.8% 2.13 Bladen Co., NC 29.3% 1.54 Baltimore Co., MD 8.8% 2.02 Barton-Lexa, AR 30.1% 1.59 Queens, NY 16.9% 2.60 Lincoln Co., WV 27.7% 1.48 Clark Co., NV 14.8% 2.54 Tunica, MS 35.5% 1.82
III. Impact of Number Weighting It matters of you’re big, not if you’re poor…
The Impact of Number Weighting Including number weighting rather than weighting on the basis only of eligible student percentage means: In 2008-09, about $408 million was shifted among districts, both interstate and intrastate. • About $196 mil. in Targeted grants was shifted among districts throughout the nation, both interstate and intrastate. • About $ 218 mil. in EFIG funds was shifted among districts but only among districts in the same state. (Numbers do not add because some who gain under Targeted program lose under EFIG and vice versa. The $408 million total is net of all winners and losers in both programs). Overall, about 550 district gained money. About 10,760 district lost money.
Who gets hurt? • 4.3 million Title I students are in districts that lost funding due to number weighting. 48.7% of all Title I students. • Three-fifths of them (2.67 million) were in districts with above average Title I eligibility rates (high poverty).
Helped and Hurt Most Districts that gain the most: • Large districts with moderate to low poverty rates – suburbs • High absolute number of Title I students – inner cities. Districts that lose the most: • Small districts with high poverty rates. • Small-to-moderate sized urban districts with high poverty rates • Nearly all districts in states with very large high poverty urban districts • Nearly all small and moderate sized districts in every state. About 8,000 small districts lose 15% or more.
High-Poverty Rural Districts Lose The 900 rural and small town districts with highest student poverty rates collectively lost $54.5 million due to number weighting in 2008-09, compared to what they would received if all districts were weighted only on percentage of eligible students. At 37%, the Title I eligibility rate in these rural districts is higher than that of nearly all large urban districts. Still, the Denver School District received 35% more money per Title I student than these rural districts received on average. Newark, 52% more. New York 58% more. Chicago, 63% more. Philadelphia, 64% more. All have lower eligibility rates than the Rural 900 districts.
Impact of Number Weighting on Districts Separated into Poverty Groupings
Very High Poverty Districts Separated Into Size Groupings
Very Low Poverty Districts Separated into Size Groupings
Top 25 Rural Districts That Lose Funding Due to Number Weighting
Top 25 Urban Districts the Gain Funding Due to Number Weighting
Top 25 Urban Districts That Lose Funding Due to Number Weighting
Top 25 Suburban Districts That Gain Funding Due to Number Weighting
Remedies: Number Weighting • Eliminate number weighting. Weight student count on percentage only. • Eliminate number weighting option, but hold harmless those districts that benefitted from it. • Eliminate number weighting option, but hold harmless high poverty districts that benefitted from it. • Limit future eligibility for number weighting to districts with a high poverty rate. • Reduce the weights used in the number weighting scale, especially in higher brackets. • Increase number weighting bracket size so fewer students are counted in higher brackets. • Increase the weights in the percentage weighting brackets. • Some combination of the above.
IV. Formula Fairness Campaign Making it right…
Formula Fairness Campaign Goal Eliminate unfair and discriminatory treatment of small and rural districts in the formula for distributing funds to local school districts under Title I of the Elementary and Secondary Education Act. Focus on reauthorization of Elementary and Secondary Education Act (aka No Child Left Behind) in 2010 or 2011.
Formula Fairness Campaign Strategy • Building the Case – Tools for Advocates • Building the Base –Get FFC Sign-on from • Building Awareness • Building Remedies • Engaging the Base
Formula Fairness Campaign Strategy V • Engaging the Base – What you can do to help • Visit www.formulafairness.com. Learn the issues • Sign up for information updates and Action Alerts. • Respond to calls for action in Action Alerts • Sign FFC petition asking Congress and the Administration to end discrimination • Forward the petition to others to sign. • Contact the most-affected districts in your state – steer them to campaign website: www.formulafairness.com • Download background information and share it with friends. • Find out how your school district and other districts in your state fare under Number Weighting. Visit the website and follow the link to a district-by-district searchable data base that shows how every district in the nation is affected. Compare high poverty small rural districts with low-poverty large urban or suburban districts. • Use that information in a letter to your Senators and Representative.
Add Your Organization’s Name as Co-Sponsor of the Formula Fairness Campaign
Join Now! Formula Fairness Campaign Rural School and Community Trust www.formulafairness.com Contact Marty Strange marty.strange@comcast.net (802) 728-4383