Download
1 / 38
390 likes | 624 Views
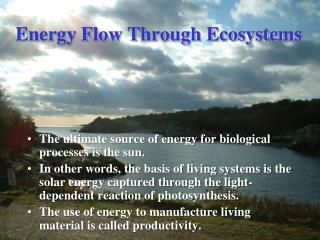
36.2 Energy flows through ecosystems. There is a limited amount of energy in an ecosystem. It is divided among the different trophic levels . This energy budget influences the types and numbers of organisms in an ecosystem.

E N D
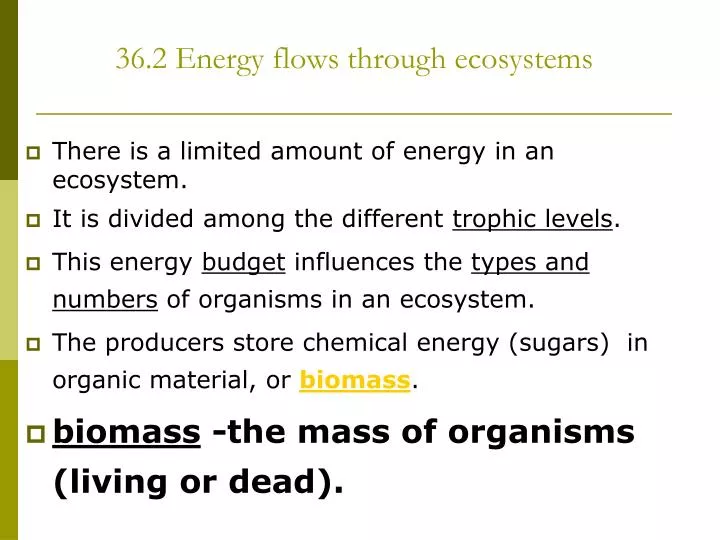
36.2 Energy flows through ecosystems • There is a limited amount of energy in an ecosystem. • It is divided among the different trophic levels. • This energy budget influences the types and numbers of organisms in an ecosystem. • The producers store chemical energy (sugars) in organic material, or biomass. • biomass -the mass of organisms (living or dead).
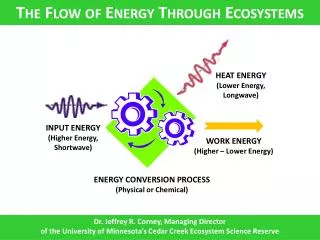
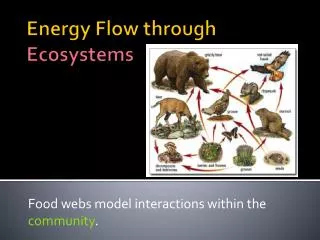
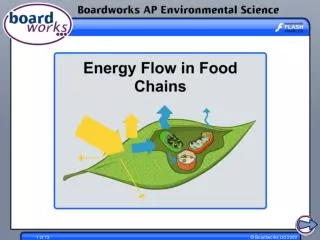
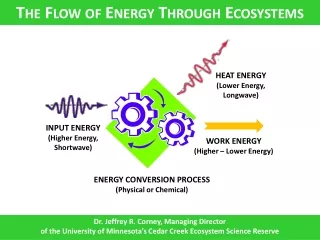
Primary Productivity • The rate at which producers build biomass is called primary productivity. • Primary productivity determines the maximum amount of energy available to the higher trophic levels in an ecosystem. • 90% of Energy is “spent” at each step in the food web. (metabolism, heat…)
Why a Pyramid? • Producers must comprise most of the mass of the biotic part of an ecosystem • This is the ONLY place where energy (solar) enters the ecosystem • Energy is always lost in the form of heat, so energy transfers are no more than 10% efficient (90% energy lost as heat)
3 Types of Pyramids 1.) Energy Pyramid- depicts energy loss from one trophic level to the next. • Only 10% of available energy at a trophic level is converted to biomass at the next higher trophic level.
Figure 36-7This generalized energy pyramid indicates that only 10 percent of the energy available at a trophic level is typically converted to new biomass in the next trophic level.
2.) Biomass pyramid- depicts the actual biomass (dry mass of all organisms) in each trophic level.
36.3 Cycles Water, Carbon, Nitrogen Oxygen and Phosphorus
36.3 Chemicals Cycle in the Ecosystem 3 basic steps of Chemical cycling: 1.) Producers use chemicals from the environment to make sugar. (photosynthesis) 2.) Consumers feed on producers, take in nutrients, release wastes into the environment. 3.) Decomposers break down dead organisms, returning inorganic chemicals to the soil, water, air producers.
Nitrogen Cycle Nitrogen Fixation: process by which some bacteria convert nitrogen gas (N2) ammonia(NH3) These bacteria live in the soil or on the roots of certain plants (beans or legumes). The ammonia picks ups another H+ ion in the soil forming ammonium (NH4+) Nitrification – process done by nitrifying bacteria. Converts ammonium (NH4+) to nitrates (NO3-).
Nitrogen Cycle • Producers absorb the ammonium and nitrates from the soil and use them to build amino acids, proteins, and nucleic acids. • Consumers obtain their nitrogen through the food web. • Decomposers release nitrogen as ammonium from the wastes of decaying living things • Denitrification – done by denitrifying bacteria. Convert some nitrates back to nitrogen gas and release it into the atmosphere
Water Cycle 3 major processes move water between land, bodies of water, and the atmosphere: 1.) evaporation: liquid gas • transpiration: evaporation from a plant’s leaves. 2.) condensation: gas liquid 3.) precipitation: rain, snow, hail and sleet
Water (hydrologic) Cycle • Plants absorb water from the soil • Transpiration and cellular respiration return water to the atmosphere • Sun causes water to evaporate clouds form • Precipitation returns water to the soil
Figure 36-12The three major processes of evaporation (including transpiration), condensation, and precipitation continuously move water between the land, bodies of water, and the atmosphere.
The Carbon Cycle • Plants remove CO2 from the air (photosynthesis) • 6 CO2 + 6 H2O C6H12O6 + 6 O2 • Consumers give of CO2during cellular respiration • C6H12O6 + 6 O2 6 CO2 + 6 H2O • Burning fossil fuels releases carbon CO2
The Oxygen Cycle • Oxygen is produced by photosynthesis • 6 CO2 + 6 H2O C6H12O6 + 6 O2 • The largest chemical process on earth! • Oxygen is required by cellular respiration • C6H12O6 + 6 O2 6 CO2 + 6 H2O
Figure 36-10Many life processes and human activities contribute to the cycling of carbon in the biosphere.
36.4 Human Activities • Burning Fossil fuels adds CO2to the atmosphere. • Carbon cycle is also affected by by deforestation. • Deforestation: the clearing of forests for agriculture, lumber, and other uses. • It clears plants that absorbs CO2, burning the trees releases CO2 into the atmosphere. • CO2 traps the sun’s heat, producing the green house effect. • As CO2 levels in the atmosphere rise, more heat is trapped, and the average temperature rises Global warming.
Figure 36-14The greenhouse effect is a natural process that stops all of the sun's heat from escaping rapidly back to space. This process can be altered by human activities that affect the levels of greenhouse gases in the atmosphere.
Ozone • Pollutants can affect ozone (O3) molecules. • Ozone (O3) absorbs ultraviolet light. • Ozone layer: region high above the Earth’s surface that shields organisms from the sun’s damaging rays. • Pollution damages our ozone layer.
Figure 36-18Free chlorine atoms in the atmosphere react with and destroy ozone molecules. Over time, the loss of ozone has resulted in an ozone "hole"—an area of very low ozone concentrations located over Antarctica.
The following pictures are provided courtesy of NASA. They show the extent of ozone thinning. Dark blue colors correspond to the thinnest ozone, while light blue, green, and yellow pixels indicate progressively thicker ozone. October 1999 (average)Historically, the Antarctic ozone hole is largest during October. This image shows the data from the Total Ozone Mapping Spectrometer (TOMS) Earth Probe, for the month of October 1999 September 3rd 2000The ozone hole grew quicker than usual and exceptionally large. By the first week in September the hole was the largest ever at that time 11.4 million square miles. For the first time it reached towards South America and to regions of high population. September 17th 2001Satellite data show the area of the 2001 Antarctic ozone hole peaked at a size roughly equal to that of recent years about the same area as North America. Researchers have observed a leveling-off of the hole size and predict a slow recovery.
Definitions Bioaccumulation: isthe process by which substances not readily broken down or excreted can build up and be stored in living tissue (usually in fatty tissue.) Biomagnification: is the process by which substances become more concentrated in the bodies of consumers as one moves up the food chain (trophic levels).
Figure 36-17In this Great Lakes food chain, the concentration of PCBs measured in herring gull eggs was almost 5000 times higher than that measured in phytoplankton. The concentration increased at each successive trophic level.
Case Study: PCBs PCBs, or polychlorinated biphenyls, are a group of man-made chemicals. Introduced in 1929 and widely used in electrical transformers, cosmetics, varnishes, inks, carbonless copy paper, pesticides and for general weatherproofing and fire-resistant coatings to wood and plastic. The federal government banned the production of PCBs in 1976 PCBs can effect the immune system, fertility, child development and possibly increase the risk of certain cancers
Case Study:DDT DDT is a pesticide that was widely used until being banned in the U.S. in 1972 DDT accumulates in living tissue, particularly in fat tissue High concentrations in some bird species caused failure of eggs by thinning the shells
Case Study:Methyl Mercury U.S. Department of the Interior, U.S. Geological Survey, Center for Coastal GeologyThis page is: http://sofia.usgs.gov/sfrsf/rooms/mercury/achilles_heel/cause.html
Miscellaneous terms • Biodiversity – a measurement of the amount of different kinds of organisms (species) in a location. • Climatograph – displays the seasonal variations in temperature and precipitation for a location