Download
1 / 22
220 likes | 371 Views
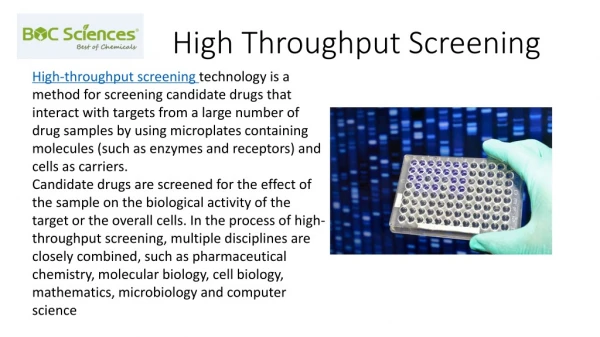
High throughput isolation of individual glycoproteins ( affinity SPE tools). Jana Vidič BIA Separations d.o.o Split, 2nd of October 2013. WP2 – affinity SPE tools.

E N D
High throughput isolation of individual glycoproteins (affinity SPE tools) • Jana Vidič • BIA Separations d.o.o • Split, 2nd of October 2013
WP2 – affinity SPE tools Development of 96 well monolithic plates for isolation of individual plasma proteins - with immobilizied mAbs (delivery date 48 month) : Transferrin, Fibrinogen, Haptoglobulin and Alpha 1-acid glycoprotein
BIASep tasks – WP2 • Activation of the monolithic support for further immobilization • Development of the immobilization procedure and testing of the imobilized antibody (a comercial monoclonal antibodies was used) • Production of the ordered anti-transferrin-mAb and anti-fibrinogen-mAB at the final stage (from MEDRI and Biotechnical faculty Ljubljana) • Immobilization of anti-transferrin and anti-fibrinogen on monolithic columns
Activation of the matrix for further imobilization- literature - beads- • Affinity-purified antibodies conjugated to Hydrazide matrix Affinity separation and enrichment methods in proteomic analysis. X. Fang, W. Zhang, J. Proteomics 71 (2008 ) 284 – 303 Immunoaffinity separation of plasma proteins by IgY microbeads: Meeting the needs of proteomic sample preparation and analysis. Huang L. et al., Proteomics 2005, 5, 3314–3328 • Antibody immobilization using heterobifunctional crosslinkers Affinity separation and enrichment methods in proteomic analysis. X. Fang, W. Zhang, J. Proteomics 71 (2008 ) 284 – 303 • antibodies are attached to polymeric material through protein A or protein G cross-linking Multi-component immunoaffinity subtraction chromatography: An innovative step towards a comprehensive survey of the human plasma proteome. Pieper R. et al., Proteomics 2003, 3, 422–432
Activation of the monoliths Activation: • CDI monoliths were used as received from production • Aldehyde activation • Glutaraldehyde (GA) immobilization to EDA and NH3 columns • Hydrazide activation • pA crosslinking Monolithic materials: • CIM epoxy columns • CIM EDA columns • CIM CDI columns • CIM OH columns • CIM NH3 columns
Hydrazide coupling- Testing procedure- • Hydrazide monoliths were prepared with different modification solution from adipic dihydrazide; with and without hydrolysis afterwards • FTIR spectra, mass increase and elemental analyses were followed in each step to determine the optimal modification procedure. • The BCA test was additionally used to prove the presence of hydrazide groups on the monolith surface. • hydrazide monoliths were tested for pA immobilization
Hydrazide coupling- Results 1- • IR spectra confirmed the remaining IR groups and an additional broad band around 1600 cm-1, which belongs to hydrazide carbonly groups. Figure : FTIR spectra (recorded in ATR mode) of hydrazide monolith before and after the hydrolysis • Max conversion of epoxy groups was around 10%.
Hydrazide coupling- Results 2- • BCA test of the final monoliths: the formation of coloured solution with hydrazide monoliths proved the presence of hydrazide groups, while blank tests (with NH3 monolith and epoxy monolith) did not result in any colour formation • testing for DBC for polyclonal IgG (Octagam) and a pronounced capacity for the IgG was measured. Table: IgG DBC values of hydrazide-GA-recombinant pA monoliths
As testing procedure for the activated monoliths and determination of the immobilization procedure a commercial monoclonal antibodies was used. The purpose was the immobilization of the monoclonal antibody adalimumab on the monolithic support using different immobilization procedures and testing the dynamic binding capacity and selectivity of prepared monoliths towards tumor necrosis factor alpha (TNF), which is an antigen of adalimumab.
commercial mAb - CDI coupling Table: Dynamic binding capacity of mAb-CDI affinity columns As before, blank columns do not have any interaction with the columns, but even the affinity columns have very limited affinity towards the antigen.
commercial mAb - EDA coupling and Glutaraldehyde (GA) immobilization Table: Dynamic binding capacity of mAb-GA-EDA affinity columns As before, blank columns do not have any interaction with the columns. In case of EDA-GA affinity columns, the affinity of the mAb towards antigen was almost negligible. It seems that there is a small affinity of the column, prepared in phosphate buffer.
commercial mAb - Aldehyde coupling Table: Dynamic binding capacity of mAb-aldehyde affinity columns Blank columns do not have any interaction with the columns, therefore it is anticipated that theDBC value of a mAb columns results mainly from affinity interaction between mAb and antigen. The affinity of the adalimumab columns was proven, although the DBC values are not high (around 0.3 mg/ml). The difference between two different immobilization buffers is not evident.
commercial mAb - NH3 coupling and Glutaraldehyde (GA) immobilization Table: Dynamic binding capacity of mAb-GA-NH3 affinity columns Blank columns do not have any interaction with the columns, therefore it is anticipated that theDBC value of mAb columns results mainly from affinity interaction between mAb and antigen. The affinity of the adalimumab columns was proven, although the DBC values are not high (around 0.3 mg/ml). The difference between two different immobilization buffers is not evident.
commercial mAb – hydrazide activation Table: Dynamic binding capacity of mAb-hydrozide affinity columns Blank columns do not have any interaction with the columns, therefore it is anticipated that theDBC value of adalimumab columns results mainly from affinity interaction between mAb and antigen.
commercial mAb – pA crosslinking Table: Dynamic binding capacity of mAb-pA affinity columns These results are the most promising of all tested mAb columns, because the DBC value is the highest (around 0.8 mg/ml) and the breakthrough curve is steep (see Figure). Consequently the elution of antigen from the column is more than twice higher than from the columns with the capacity around 0.3 mg/ml, confirming a reversible binding. As before, blank columns do not have any interaction with the columns.
commercial mAb – pA crosslinking Figure: Dynamic binding capacity measurements of antigen over pA-mAb crosslinked monoliths From the ratio between the immobilized amount of mAb and the dynamic binding capacity for antigen the number of active mAb molecules was calculated. The molar weight of a mAb is app. 150 kDa, while the Mw of antigen is appr. 51 kD, therefore it is estimated that app. 3.3 mAb molecules bind one antigen. With other words, 2.3 adalimumab molecules are inactive towards the antigen. Probably the crosslinking optimistaion could lead to the improvements in this field.
Monolitic columns with immobilizied commercial mAb – proving selectivity • The samples were loaded as follows: • 1. Blank column; Flow-through • Blank column; elution • mAb column 5; Flow-through • mAb column 5; Elution • Aldehyde + mAb column buffer 2; FT • Aldehyde + mAbcolumn buffer 2; E • Aldehyde + mAb column buffer 1; FT • Aldehyde + mAb column buffer 1; E • Aldehyde + mAbcolumn buffer 1; E • lane marker • antigenediluted sample • column loading mixture TNFalphais trimeric protein with the total mass of 51 kDa. All three subunits are same, therefore each subunit is 17 kDa, what is clearly seen from the SDS-PAGE. All low-through samples (except the blank) contained no TNFalpha, but all the other proteins. The pure TNFalpha is present in the elution fraction as a single band at 17 kDa, what confirmed the column performance.
Monoclonal antibody: anti-Transferrin • Approx. 10 mg of an anti-transferin from Medri (production and purification in US). • from MEDRI (email in Sept13):“We have made a product analysis on the BioxCell purified Ab and we are not satisfied with the result (attach). As you can see, there are many degradation-products and they can not confirm that this is not due to their fault.“
Monoclonal antibody: anti-Transferrin- purification on protein A monolithic column- In order to remove the contaminants we loaded the sample on pA monolith. The Flow-through and elution fractions (see Figure) were collected and analysed on SDS PAGE. Obviously (see rows 2, 3 and 5) the pA does not bind selectively anti-transferrin.
Monoclonal antibody: anti-Transferrin- purification on protein G monolithic column- Analysisof binding anti-transferrin to protein G column were performed. The flow through and elution fractions were collected and analysed by SDS Page (Figure) with silver staining. The antibodies were removed from the sample, because in FT fraction there are no light and heavy chain bands. The elution contained a band, which could be assigned for heavy chain and a weak band, which could be assigned for light chains. There is still one impurity seen at app. 100 kDa, which could be a consequence of not enough reduced IgG molecules. Regarding the result, we decided to proceed with purification of higher amount of anti-transferrin on a protein G disk in the following step.
Monoclonal antibody: anti- Fibrinogen • Aprrox. 7 mg of an anti-fibrinogen-mAb (2 types of mAb due to 2 different clones, from BF Ljubljana • In order to remove the contaminants we loaded the sample on pA monolith. MAB @ fibrinogen 1H5/B7 1&2: Load - unreduced and reduced 3&4: CIMAC pAFT- unreduced and reduced 5&6: CIMAC pAE - - unreduced and reduced
Issues • Further imobilization of mAb just on pA or pG crosslinked and hydrazide monolithic columns? • How to receve more pure monoclonal antibody? – purification in BIASep • Buy a polyclonal anti-transferin and check the imobilization procedure?