Download
1 / 9
90 likes | 272 Views
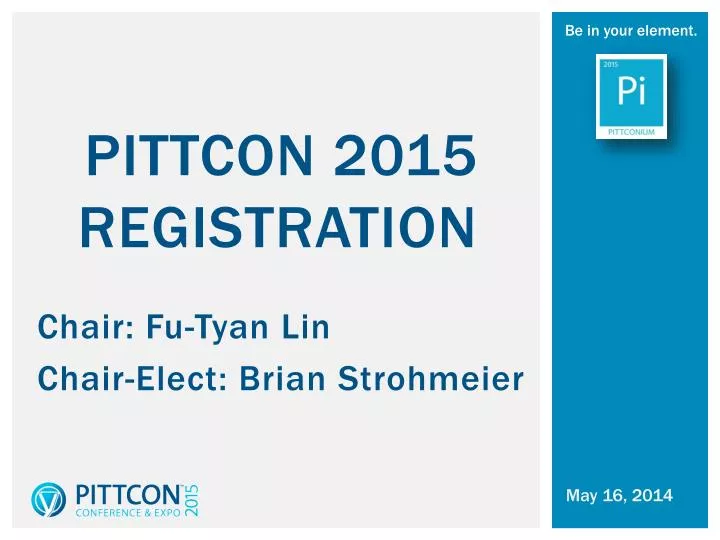
Be in your element. PITTCON 2015 RegistrATION. Chair: Fu- Tyan Lin Chair-Elect : Brian Strohmeier. May 16, 2014. PITTCON 2014 Registration REPORT. HISTORICAL REGISTRATION COMPARATIVE (PITTCON 2014, 2013 and 2012). PITTCON 2014 Lead AND RETRIEVAL Count Summary.

E N D
Be in your element. PITTCON 2015 RegistrATION Chair: Fu-Tyan Lin Chair-Elect: Brian Strohmeier May 16, 2014
HISTORICAL REGISTRATION COMPARATIVE (PITTCON 2014, 2013 and 2012)
PITTCON 2014Lead AND RETRIEVAL Count Summary • PITTCON 2014 Lead and Retrieval Number of participating Companies was 612
Proposed PITTCON 2015 REGISTRATION FEES • Regular Full Fee $350 • Discount fee by Dead Line (February 20) $175 • One day Fee $175 • Student Fee $60 • Booth Staff (Over Allotment) $120 • Corporate Guest (Over Allotment) $65 • Free day on Thursday
2014 2013 2012 • CURRENT PREVIOUS VARS # VARS % PREVIOUS VARS # VARS % • Attendee • Complimentary Guest 289 284 5 2 % 247 42 17 % • Complimentary Pittcon 100 134 (34) 25 % 100 0 0 % • Conferee 3,992 4,570 (578) -13 % 4,286 (294) -7 % • Corporate Guest 2,248 3,053 (805) 26 % 2,261 (13) -1 % • Food Labs Academia/Government 2 5 (3) -60 % 0 2 0 % • Food Labs Conferee 38 66 (28) -42 % 0 38 0 % • Food Labs Tuesday Only 4 0 4 0 % 0 4 0 % • Graduate Student 718 569 149 26 % 640 78 12 % • Invited Speaker 596 694 (98) 14 % 589 7 1 % • Monday Only 214 217 (3) -1 % 140 74 53 % • Presider 74 97 (23) -24 % 73 1 1 % • Thursday Only 827 791 36 5 % 292 535 183 % • Tuesday Only 256 227 29 13 % 138 118 86 % • Wednesday Only 209 235 (26) -11% 142 67 47 % • Total Attendee 9,567 10,942 (1,375) -113 % 8,908 659 7 % • Exhibitor • Exhibitor 6,220 6,858 (638) -9 % 6,384 (164) -3 % • Total Exhibitor 6,220 6,858 (638) -9 % 6,384 (164) -3 % • Other • Media 190 202 (12) -6 % 182 8 4 % • Undergraduate Student 278 194 84 43 % 280 (2) -1 % • Total Other 468 396 72 18 % 462 6 1 % • ___________________________________________________________________________________________ • Grand Total: 16,255 18,196 (1,941) -11 % 15,754 501 3 %