Download
1 / 35
360 likes | 532 Views
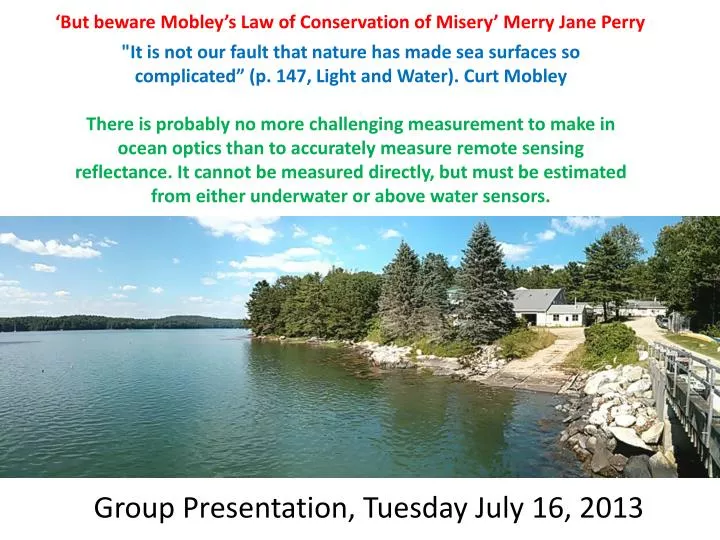
‘But beware Mobley’s Law of Conservation of Misery’ Merry Jane Perry. "It is not our fault that nature has made sea surfaces so complicated” (p. 147, Light and Water). Curt Mobley

E N D
‘But beware Mobley’s Law of Conservation of Misery’ Merry Jane Perry "It is not our fault that nature has made sea surfaces so complicated” (p. 147, Light and Water). Curt Mobley There is probably no more challenging measurement to make in ocean optics than to accurately measure remote sensing reflectance. It cannot be measured directly, but must be estimated from either underwater or above water sensors. Group Presentation, Tuesday July 16, 2013
This is qualitative and semi quantiative • Sources of Uncertainty • Accuracy in angle measurement • Cloud cover • Sea state • Surface reflected glint correction
Secchi Disks • Named after Padre Pietro Angelo Secchi • A longstanding optical proxy of sea clarity. Image Source : Wernand Thesis, 2011
HyperSAS • Re-emission also L_sky = L_T
Rrs Sensitivity to Azimuth Angle Rrs measured at the theoretical optimum angle of 35˚, 135˚ falls in between measurements made at other zenith angles
Rrs Sensitivity to Zenith Angle Measurements at multiple zenith angles was limited (only two at the same azimuth angle). Zenith appears to cause a much larger difference at 45˚ degree azimuth then at a 90 ˚ azimuth
Seaweed in HyperSAS • Group 2 pulled seaweed in front of the HyperSAS to determine its effect on the measurement. • Intentional contamination showed a clear “red edge” reflectance • Group 1 thought it may have had seaweed contamination on one reading. • Little effect from accidental contamination in this case
WISP (Water Insight SPectrometer) • Hand-held hyperspectral spectrometer • Provides Ro (reflectance), Lu, Ld, Ed • One vertical (up) spectrometer, 2 spectrometers at 42 degrees • Measures 400 – 800 nm
WISP Issues: • Group 2: Not functioning • Group 1: Lacking proper notes for all samples Future Suggestions: • Synchronize watch with meter time • Always right down Chl and TMS readings when measuring for later file matching • Meter setting for Rrs export?
WISP Data* Upper Dock 1/sr 135E Kelp • Dock shows high reflectance, location with kelp shows high reflectance in the 700-800 range, all other samples (including 135E no kelp) show similar trends
Lower Reflectance Data 135E Kelp 1/sr • UD = upper dock, Ld= lower dock • All angles are from 0 degrees = sun
Lower Dock Only Angle Increases ReflectanceIncreases
HyperSAS and WISP Comparison QUALITATIVE COMPARISON WISP compares well to HyperSAS data for common zenith and azimuth angles 35˚, 135˚ WISP underestimates Rrs for long wavelengths in both cases 35˚, 180˚
Group 1: Hyperpro • Waves had no effect on Ed. • Lu was lower when Ed detector is facing towards the Sun. • Lu was high in the green region because of high Chl conc. Water.
Group 2: Hyperpro • Ed looks like we expected. Rotation didn’t affect it. • Lu doesn’t look so great, may have forgotten to turn off “immersion” setting?
G1 • Ed had minimum difference between various positioning towards the Sun. • Consistent with the previous method-- Lu is lower again when facing the Sun.
G2 • Ed, when rotated into the sun, was lower for two separate trials. Would have expected them to be more similar, like last plot. Cloud, perhaps? • Lu has replicates that look good, and all look as we’d expect: • All spectra suggest green waters, which is definitely what we see from the dock • Lu was lower when Ed detector was rotated into the sun (Lu detector was in instrument’s shadow)
Kd from Secchi Disks • From ACS data, a(530nm)=0.54, c(530nm)=2.51 • Poole & Atkins (1929) calculated that zscagrees well with 1.7/Kd • for our case, Z_sc=2.13m, K_d=0.8 • Idso & Gilbert (1974) did a number of experiments using (then) modern equipment which found that Poole & Atkins was surprisingly accurate. • Other relationships have been suggested, but Poole & Atkins appears to have a solid body of evidence in a number of different waters.
Rrs Calculation from radiometric data • Immersion Method: • Lu is measured by a radiance sensor at depth (z). • Ed is measured an planar irradiance sensor at the surface. • Rrs = Lw= Lu(z)* Tas* 1where n = index of refaction, EsT n2EsT(as)= transmission at the air-sea interface, Lw = water leaving radiance, Es= incident sky irradiance, and T=transmission=e-∫kLu(z)dz • Lee Method: • Assuming that the Lee setup does directly measure Lw– then the calculation is simply: Rrs = Lw Es Lee setup measures Lw directly
Remote Sensing Reflectance (Rrs) Rrs higher towards sun than away from sun. Both Lee and Immersed Lu are comparable to the WISP and HyperSass data. Rrswill improve with better K measurement.
Group 1: Ed PAR Values • Values should be all approximately the same, as orientation of the HyperPro should have minimal effect on the Ed sensor • A drop was observed between Group 1 and Group 2, but it was likely just a function of time of day (next slide) • If the point was to find ways to occlude the Ed sensor, we did not achieve that.
Ocean Optic Spectrometer Detectorrange: 200-1100 nm Integration time: 3.8 ms - 10 seconds Dark noise: 50 RMS counts
Spec Calibration E: Irradiance L: Radiance M: Measurement D: Dark B: Bulb measurement T: Integration time R: Reflectance (0.93 for Lambertian surface) We normalized measurements by integration time.
Calibration results Radiance=Irradiance*R/PI
Practical Aspects • Difficult to get full coverage quickly • Very sensitive to noise • Must normalize to integration time • Need horizon views • Must fully understand azimuth and zenith angle definitions • Arm gets tired
Radiance along Principle Plane Colors represent different groups
Skyradiancedistribution (Liang and Lewis, 1996) • Figure give a example of simulated sky radiance distribution with solar zenith angle at 300, in the azimuth planes 00-1800. • The radiance peak occurs in the solar zenith angle and radiance decreased at both directions away the sun.