Download
1 / 16
160 likes | 300 Views
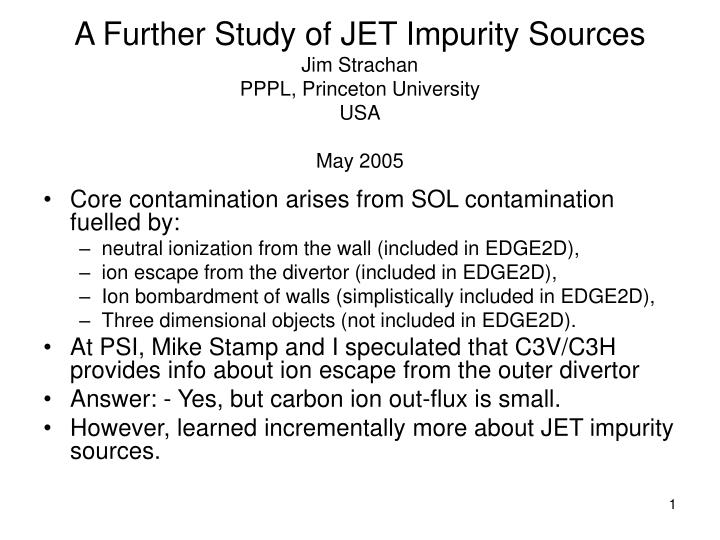
A Further Study of JET Impurity Sources Jim Strachan PPPL, Princeton University USA May 2005. Core contamination arises from SOL contamination fuelled by: neutral ionization from the wall (included in EDGE2D), ion escape from the divertor (included in EDGE2D),

E N D
A Further Study of JET Impurity SourcesJim StrachanPPPL, Princeton UniversityUSAMay 2005 • Core contamination arises from SOL contamination fuelled by: • neutral ionization from the wall (included in EDGE2D), • ion escape from the divertor (included in EDGE2D), • Ion bombardment of walls (simplistically included in EDGE2D), • Three dimensional objects (not included in EDGE2D). • At PSI, Mike Stamp and I speculated that C3V/C3H provides info about ion escape from the outer divertor • Answer: - Yes, but carbon ion out-flux is small. • However, learned incrementally more about JET impurity sources.
Method • Philosophy: use an ensemble of EDGE2D runs to encompass the experimental parameter scans and uncertainties. • Created an ensemble of EDGE2D runs with variations in ΓD, ΓC, χe=χi, D, DC, YC, EC, PSOL • Study C3H, C3V, C3I, C3O, DαH, DαV, DαI, DαO from these simulations • Compare to JET L-Mode and inter-ELM H-Mode plasmas from J. Strachan, et al, NF 43, 922 (2003). • Some limitations: spatially constant transport coefficients, no pinch velocity, no ELMs.
Carbon density profiles from carbon injected at OSP indicate Carbon leaves the divertor as ions, and low ionizations states Occur in the lower vessel
Poloidal distribution of carbon ionization calculated by EDGE2D RED = carbon Uniformly injected Along wall Blue = natural sputtering Green = carbon Injected from Outer strike point
EDGE2D carbon migration pattern Fraction of carbon ½ of carbon goes to inner divertor and ½ to grid edge (wall) independent of source location
First result: C3H provides a good approximation to the carbon ionization in the SOL Unity
Second Result: Ratio C3H/C3V provides info on C ion out flux from outer divertor Unity
Compare to Experiment: JET L-MODE plasmas have CIII signals like a uniform wall source unity
To study SOL C ionization, must first establish D influx = outflux
The density rise in EDGE2D seems different than observed In JET L-Mode. Note, separatrix density is assumed <ne>/3. Exp has more recycling at low density, and less density rise At high injection, also little correlation with τE. Note fuelling rate adjusted since EDGE2D only fuels the grid, and not the entire core
Both EDGE2D and JET L-Mode indicate a correlation of SOL And divertor deuterium influx with density, however, JET has higher At higher density. Both EDGE2D and JET L-Mode have less Recycling at higher confinement. FLX FLX FLW FLW JET L-Mode EDGE2D
At low density, EDGE2D predicts the L-Mode recycling, but Underestimates it at high density, while over-estimating H-Mode FLX FLW
Experimentally, the Yield is defined by the ratio of carbon to deuterium Light. EDGE2D, indicates that this ratio correlates with the Carbon to deuterium ionization rates in the SOL
SOL ionization rates: D rate is similar for EDGE2D, JET L-Mode, and JET Inter-ELM H-Mode, with experiment extending to higher values. C rate is similar for EDGE2D and L-Mode but higher for H-Mode
Both L-Mode and EDGE2D indicate that the yield decreases as Density increases, although stronger in L-Mode. Inter-ELM H-Mode has higher Yield values.
Discussion • EDGE2D (chemical sputtering = ½ Haasz): • C3H is an indicator of SOL C ionization • C3H/C3V can indicate C ion escape from outer divertor • Described the C Yield at low density on L-Mode • Recycling correlates with SOL deuterium diffusivity • JET L-Mode: • Uniform C wall source • Enhanced recycling at high density • Recycling inversely correlates with confinement • C Yield about equals EDGE2D • JET H-Mode: • C wall source stronger than L-Mode • Recycling lower than EDGE2D • C Yield 2X higher than EDGE2D, indicating another source