Download
1 / 64
640 likes | 649 Views
Lecture 11: Inflation and Unemployment. Inflation. Definition price levels and inflation rates consumer price index and consumer price inflation GDP deflator and GDP inflation other price levels and rates of inflation.

E N D
Inflation Definition price levels and inflation rates consumer price index and consumer price inflation GDP deflator and GDP inflation other price levels and rates of inflation
QSuppose that the CPI in a country increases from 150 to 153 over a period of a year. What is the annual rate of inflation? 3% 2% 1.02% 0.03% 0.02%
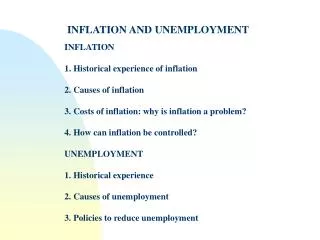
Inflation Definition price levels and inflation rates consumer price index and consumer price inflation GDP deflator and GDP inflation other price levels and rates of inflation Hyperinflation
Yugoslavian banknote, 1994 Zimbabwe banknote, 2008
Inflation Types of inflation demand pull
Demand-pull inflation AS Price level P1 AD1 O Q1 National output
Demand-pull inflation Q2 AS Price level P2 P1 AD2 AD1 O Q1 National output
Inflation Types of inflation demand pull • cost push • effect of ‘one-off’ cost shocks • effect of continuous upward shifts in AS curve
QWhich one of the following would be the cause of cost-push inflation? A cut in the rate of income tax. A cut in the rate of VAT. A cut in interest rates. A rise in the exchange rate. A rise in the price of oil.
Cost-push inflation AS1 Price level P1 AD O Q1 National output
Cost-push inflation Q2 AS2 AS1 Price level P2 P1 AD O Q1 National output
Inflation Types of inflation demand pull cost push effect of ‘one-off’ cost shocks effect of continuous upward shifts in AS curve interaction of demand-pull and cost-push inflation
The interaction of demand-pull and cost-push inflation AS1 Price level P1 AD1 O National output
The interaction of demand-pull and cost-push inflation P2 AS2 AS1 Price level P1 AD2 AD1 O National output
The interaction of demand-pull and cost-push inflation P3 AS3 AS2 AS1 Price level P2 AD3 P1 AD2 AD1 O National output
Inflation Types of inflation demand pull cost push effect of ‘one-off’ cost shocks effect of continuous upward shifts in AS curve interaction of demand-pull and cost-push inflation expectations and inflation
QIn a period of rapid inflation which of the following would be the least desirable store of wealth? Vintage wine Property Money Land Stocks and shares
Money Supply, Aggregate Demand & Inflation The quantity theory of money The equation of exchange: MV = PY M = money supply V = velocity of circulation P = price level (number of times greater than in base year) Y = real value of output at base-year prices The link between money and prices quantity theory holds if V and Y are determined independently of M
Money Supply, Aggregate Demand & Inflation The relationship between money supply and aggregate demand the short run how interest-rate sensitive is money demand? how interest-rate sensitive is spending? how interest-rate sensitive is the exchange rate? the long run stronger link between M and PY in the long run the theory of portfolio balance
Inflation and changes in aggregate demand the short-run aggregate supply curve relatively elastic in short run stickiness of wages and prices confidence Money Supply, Aggregate Demand & Inflation
Short-run aggregate supply curve P1 Y1 AS Price level AD1 O National output
Short-run aggregate supply curve P2 Y2 AS As full-capacity output is approached, so aggregate supply is less and less able to respond to an increase in aggregate demand. Price level P1 AD2 AD1 O Y1 National output
Money Supply, Aggregate Demand & Inflation • Inflation and changes in aggregate demand • the short-run aggregate supply curve • relatively elastic in short run • stickiness of wages and prices • confidence • the long-run aggregate supply curve • relatively inelastic • the interdependence of markets • the flexibility of prices
The long-run aggregate supply curvewhen firms are interdependent P2 b P1 a AD2 Y2 Y1 AS1(short run) Price level AD1 O Real GDP (Y)
The long-run aggregate supply curvewhen firms are interdependent AS(long run) AS2 (short run) c P3 AS1(short run) Price level Prices rise more in the long run as price increases are passed from firm to firm. P2 b P1 a AD2 AD1 O Y2 YP Real GDP (Y)
Money Supply, Aggregate Demand & Inflation • Inflation and changes in aggregate demand • the short-run aggregate supply curve • relatively elastic in short run • stickiness of wages and prices • confidence • the long-run aggregate supply curve • relatively inelastic • the interdependence of markets • the flexibility of prices • the effects of investment on aggregate supply
Effect of investment on the long-run AS curve a AS1 (short run) Price level AD1 National output
Effect of investment on the long-run AS curve AS2 (short run) b AS (long run) d AS1 (short run) Price level a Increased potential output in the long run from higher investment AD2 AD1 National output
QThe long-run aggregate supply curve is likely to be steeper: The greater the flexibility of prices The more independent markets are from each other. The more firms respond to a rise in demand by investing in equipment embodying new technology The less people expect higher demand to result in higher prices. The more people expect higher demand to result in higher output and employment.
Unemployment The meaning of 'unemployment' The costs of unemployment Official measures of unemployment claimant unemployment do claimant statistics give a true picture of unemployment? standardised unemployment (ILO/OECD) based on labour force survey
QIf there are 3 million people unemployed and 24 million people employed, the rate of unemployment will be: 3 per cent 8 per cent 9 per cent 11.1 per cent 12.5 per cent
Unemployment • The meaning of 'unemployment' • The costs of unemployment • Official measures of unemployment • claimant unemployment • do claimant statistics give a true picture of unemployment? • standardised unemployment (ILO/OECD) • based on labour force survey • considerable variation between and across countries • female rates typically higher – though lower in UK • rates for those under 25 typically higher – less so in Germany
Unemployment Unemployment and the labour market the aggregate demand and supply of labour equilibrium in the model
Equilibrium in the model Qe ASL Average (real) wage rate We ADL O No. of workers
Unemployment • Unemployment and the labour market • the aggregate demand and supply of labour • equilibrium in the model • disequilibrium unemployment
Disequilibrium unemployment B A Q2 Q1 ASL Average (real) wage rate W2 We ADL O No. of workers
Unemployment • Unemployment and the labour market • the aggregate demand and supply of labour • equilibrium in the model • disequilibrium unemployment • equilibrium unemployment
Equilibrium unemployment ASL Average (real) wage rate e We ADL O Qe No. of workers
Equilibrium unemployment d Q2 ASL N Average (real) wage rate e We ADL O Qe No. of workers
Equilibrium and disequilibrium unemployment Disequilibrium unemployment ASL Average (real) wage rate b a W2 e We ADL O No. of workers
Equilibrium and disequilibrium unemployment Disequilibrium unemployment Equilibrium unemployment ASL N Average (real) wage rate b a c W2 e We ADL O No. of workers
Unemployment Types of disequilibrium unemployment real-wage (classical) unemployment demand-deficient (cyclical) unemployment downward ‘stickiness’ of real wages fall in demand for labour efficiency wages insider power growth in the labour supply
QWhich of the following defines real-wage unemployment? Real wages being set above the equilibrium level by trade unions, or minimum wage legislation. Inflation causing an erosion of real wages and hence a rise in unemployment. Increased aggregate demand in the economy driving up equilibrium real wages. Increased aggregate demand in the economy causing money wages to rise faster than real wages. Real wages falling below the equilibrium level as a result of deficiency of demand.
Unemployment Types of equilibrium unemployment frictional (search) unemployment structural unemployment changing pattern of demand technological unemployment regional unemployment seasonal unemployment
QFrictional unemployment is the result of: a shift in the pattern of consumer demand. workers and employers being ill-informed about the labour market. the introduction of new technology. the economy entering the recessionary phase of the business cycle. employers responding to the time of year and cutting back on their level of production.
Inflation & Unemployment: Short-run 'Full-employment' national income 'Gap' analysis the recessionary gap
The recessionary gap a b Recessionary gap W, J, E Recessionary gap The amount by which national income exceeds aggregate expenditure at the full-employment level of national income Y E O Ye YF Y
The recessionary gap W, J, E Y E a b Recessionary gap W c J d O Ye YF Y
Inflation & Unemployment: Short-run • 'Full-employment' national income • 'Gap' analysis • the recessionary gap • the inflationary gap