Download
1 / 26
280 likes | 539 Views
Unemployment and Inflation. Topics. Measuring unemployment Frictional, structural, seasonal and cyclical unemployment Full employment Sources and consequences of inflation Relative price changes Nominal and real interest rates. Population Labor Force Categories.

E N D
Topics • Measuring unemployment • Frictional, structural, seasonal and cyclical unemployment • Full employment • Sources and consequences of inflation • Relative price changes • Nominal and real interest rates
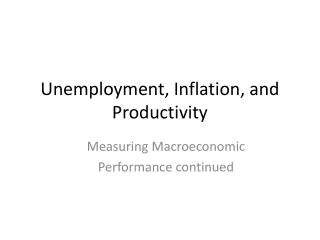
Population Labor Force Categories Young and institutionalized Working-age population Labor Force Not in labor force Employment Unemployment • Working-age population – is the total number of people aged 16 years and above • The working-age population are further divided into 2 groups: those in the labour force and those not in the labour force • Labour force= sum of the employed and the unemployed • To be counted as unemployed, a person must be available for work must be in one of 3 following categories: • 1. without job but has made specific efforts to find a job • 2. waiting to be called back to a job or has been laid off • 3. waiting to start a new job
Three Labor Market Indicators 1. The unemployment rate – is an indicator of the extent to which people who want jobs can’t find them. Does not include discouraged workers - those who are no longer looking for work but are unemployed Unemployment = Number of people unemployed X 100 rate Labour force E.g. Labour force = 137.7 million Number of people unemployed = 6.2 million Unemployment rate = 6.2 X 100 = 4.5 % 137.7
2. Labor force participation rate The number of people who join the labor force is an indicator of the willingness of people of working age to take jobs. Labor force = Labor force X 100 Participationworking-age population rate E.g. Labour force = 137.7 million Working-age population = 205.2 million Labor force participation rate = 137.7 X 100 = 67.1 % 205.2
3. The employment-to-population ratio –number of people of working age who have jobs is an indicator of both the availability of jobs and the degree of match between people’s skills and jobs Employment-to = No. people employed X 100 Population ratio working- age population E.g. Employment = 131.5 million Working-age population = 205.2 million Labor force participation rate = 131.5 X 100 = 64.1 % 205.2 4. Discouraged workers– those who drop out of the labor force in frustration because they can’t find work – not counted as unemployed
The Adult Population Sums the Employed, the Unemployed, and Those Not in the Labor Force
Sources of Unemployment Frictional Seasonal Structural Cyclical
1. Frictional Unemployment • Unemployment that arises from normal labor turnover – from people entering and leaving the labor force and from the ongoing creation and destruction of jobs • Caused by time required to bring together labor suppliers and labor demanders • Employers need time to learn about the talent available • Job seekers need time to learn about employment opportunities • While these unemployed are searching they are frictionally unemployed • Generally short-term and voluntary
2. Seasonal Unemployment • Caused by seasonal changes in labor demand during the year – during cold winter • To eliminate the impact of such changes, monthly unemployment statistics are seasonally adjusted, which smoothes out these factors
3. Structural Unemployment • Exists because unemployed workers often • Do not have the skills demanded by employers, or • Do not live where their skills are in demand • Occurs because changes in tastes, technology, taxes, or competition reduce the demand for certain skills and increase the demand for other skills • Structural unemployment poses more of a problem because workers must develop the skills demanded in the local job market.
4.Cyclical Unemployment • Fluctuates with the business cycle, increasing during recessions and decreasing during expansions • Government policies to stimulate aggregate demand during recessions is aimed at reducing this type of unemployment
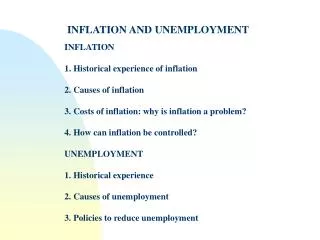
Full Employment • There is always some unemployment • Full employment occurs only if there is no cyclical unemployment or when all the unemployment is frictional, structural, or seasonal • The unemployment rate at full employment is called the natural rate of unemployment • Occurs when from 4% to 6% of the labor force is unemployed
Real GDP Real GDP Potential GDP Year 1980 1983 1986 1989 1992 1995 1998 Unemployment rate Unemployment rate Natural rate of unemployment Year 1980 1983 1986 1989 1992 1995 1998
Inflation • Inflation: a sustained increase in the average price level • Hyperinflation: extremely high inflation • Deflation: a sustained decline in the average price level • Disinflation: a reduction in the rate of inflation
Inflation • Inflation is typically measured annually • Annual inflation rate is the percentage increase in the average price level from one year to the next • Two sources of inflation • Demand-pull inflation • Cost-push inflation
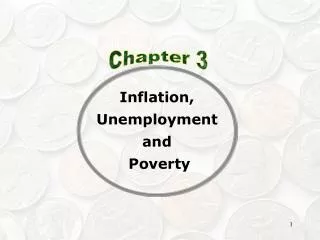
1. Demand-pull inflation • A sustained rise in the price level caused by a rightward shift of the aggregate demand curve. It is caused by any factor that increases AD such as an increase in the money supply, government spending and in exports • 2. Cost-push inflation • A sustained rise in the price level caused by a leftward shift of the aggregate supply curve. The main sources of increase in costs are: an increase in money wage rate and an increase in money prices of raw material
Inflation Caused by Shifts of AD and AS Curves Increase in costs of production push up the price level. To generate continuous cost-push inflation, the AS curve must keep shifting to the left along a given AD curve. Increase in the AD curvepulls up the price level. To generate continuous demand-pull inflation, the AD curve must keep shifting outward along a given AS curve
Anticipated versus Unanticipated Inflation • If inflation is anticipated – the money wage rate can be adjusted accordingly • Unanticipated inflation creates more problems for the economy • To the extent that inflation is higher or lower than anticipated, it arbitrarily creates winners and losers • If it is higher than expected, the winners are all those who had contracted to pay a price that anticipates lower inflation • The losers are all those who agreed to sell at that price • If inflation is lower than expected, the situation is reversed
Transaction Costs of Inflation • When prices are stable, people correctly believe they can predict future prices and can plan accordingly • But, if inflation changes unexpectedly, planning gets harder which undermines the ability of money to serve as a link between the present and the future • When dealing with the rest of the world, they must also anticipate how the value of the dollar might change relative to foreign currencies
Inflation and Interest Rates Interest is the dollar amount paid by borrowers to lenders because lenders must be rewarded for forgoing present consumption The interest rate is the interest per year as a percentage of the amount loaned 2 types of interest rates : nominal and real interest rate
a. Nominal interest rate – is the interest rate expressed in current dollars as a percentage of the amount loaned . Determined by the DD for money and SS of money in money market. The DD for money depends on nominal interest rate while SS of money is determined by the central bank’s monetary policy b. Real interest rate - interest rate expressed in dollars of constant purchasing power as a percentage of the amount loaned Real interest rate = Nominal interest rate – inflation rate
Interest Rates • With no inflation, the nominal = real interest rates • With inflation, the nominal interest rate > real interest rate • If the inflation rate is high enough, the real interest rate can actually be negative • The nominal interest would not even offset the loss in spending power because of inflation – lenders would lose purchasing power • Lenders and borrowers are concerned more about the real interest rate than the nominal interest rate – because it accurately reflects the real return to saving and cost of borrowing
The Market for Loanable Funds • This market is used to explain how financial markets coordinate the economy’s saving and investment • In the market for loanable funds – all savers go to this market to deposit their saving and all the borrowers get their loans • Loanable funds – refers to all income that people have chosen to save and lend out • In this market there is one interest rate which is both return to saving and cost of borrowing • Use SS and DD for Loanable Funds Curves
The Market for Loanable Funds (LF) • The Supply of LF comes from people who want to save and lend out (such as households deposit in bank, households buy bonds from firms) - so saving is source of Supply of LF • The Demand for LF comes from households and firms who wish to borrow to make investments – to buy house, education, new equipment, build new factory, buildings etc – so investment is source of Demand of LF • Interest rate is price of a loan – represents the amount that borrowers pay for loans and the amount lenders receive on their saving • Higher interest rate – makes borrowing expensive – the quantity of LF demanded falls - demand curve for LF slopes downward. • Higher interest rate – makes saving more attractive – the quantity of LF supplied increase - supply curve for LF slopes upward. • Equilibrium interest rate is at the intersection of the SS of and DD for loanable funds
Why is Inflation Unpopular? • Problems with unanticipated inflation • Hits those whose incomes are fixed in nominal terms • Arbitrarily redistributes income and wealth from one group to another • Reduces the ability to make long-term plans • Forces buyers and sellers to pay more attention to prices -less time for production - overall productivity of economy falls