Download
1 / 12
120 likes | 125 Views
In the present work, the synthesis and characterization are carried out on liquid crystalline compounds p-n-alkoxy benzoic acids namely p-n-octyloxy benzoic acid (8OBA) and p-n-do decyloxy benzoic acid (12OBA) compounds with 0.5 wt% ZnO nanoparticle dispersion. The differential scanning calorimetry (DSC) technique is used to measure the phase transition temperatures. Further characterization is carried out by various spectroscopic techniques like UV-visible spectroscopy (UV), scanning electron microscopy studies (SEM) and Fourier transform infra-red spectroscopy (FTIR). Textural determinations of the synthesized compounds were recorded by using polarizing optical microscope (POM) connected with hot stage and camera. The results showed that the dispersion of ZnO nanoparticles in 8OBA and 12OBA exhibited NC phases as same as the pure compounds with reduced clearing temperature as expected.

E N D
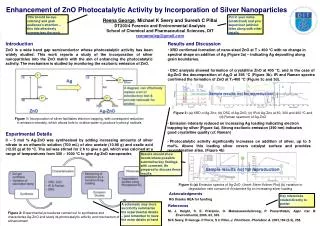
Effect of ZnO Nanoparticles Dispersed in Liquid Crystalline Alkoxy Benzoic Acids and Periodic Noise Reduction using Frequency Domain Filtering Manepalli RKNR1*, Tejaswi M1, Jayaprada P1, Rao MC2, Madhav BTP3, Giridhar G4 and Pisipati VGKM4 1Department of Physics, The Hindu College, Krishna University, Machilipatnam-521001, India 2Department of Physics, Andhra Loyola College, Vijayawada-520008, India 3Department of ECE, K. L. University, Vaddeswaram-522502, India 4Department of Nanotechnology, Acharya Nagarjuna University, Guntur-522510, India *Corresponding author: Manepalli RKNR, Department of Physics, The Hindu College, Krishna University, Machilipatnam- 521001, India, Tel: 08672-225962;E-mail: manepalli.67@gmail.com Received: March 06, 2017; Accepted: July 21, 2017; Published: July 28, 2017 Abstract In the present work, the synthesis and characterization are carried out on liquid crystalline compounds p-n-alkoxy benzoic acids namely p-n-octyloxy benzoic acid (8OBA) and p-n-do decyloxy benzoic acid (12OBA) compounds with 0.5 wt% ZnO nanoparticle dispersion. The differential scanning calorimetry (DSC) technique is used to measure the phase transition temperatures. Further characterization is carried out by various spectroscopic techniques like UV-visible spectroscopy (UV), scanning electron microscopy studies (SEM) and Fourier transform infra-red spectroscopy (FTIR). Textural determinations of the synthesized compounds were recorded by using polarizing optical microscope (POM) connected with hot stage and camera. The results showed that the dispersion of ZnO nanoparticles in 8OBA and 12OBA exhibited NC phases as same as the pure compounds with reduced clearing temperature as expected. Keywords: Synthesis; POM; DSC; Nano dispersion; UV spectroscopy; SEM, FTIR; Image enhancement Introduction Liquid crystals (LCs) are self-assembled functional soft materials which possess both order and mobility at molecular, supra- molecular and macroscopic levels [1-3]. LCs received much attention in the recent years because of their ability to transfer their long range orientational order on the dispersed materials such as nanoparticles and different colloids [4-10]. Introduction of nanoparticles do not induce significant distortion of LC phases. Nanoscience and nanotechnology are vital frontiers in scientific research. A broad area of research topics from fundamental, physical, biological and chemical Citation: Manepalli RKNR, Tejaswi M, Jayaprada P, et al. Effect of ZnO Nanoparticles Dispersed in Liquid Crystalline Alkoxy Benzoic Acids and Periodic Noise Reduction using Frequency Domain Filtering. Int J Chem Sci. 2017;15(3):167 © 2017 Trade Science Inc. 1
www.tsijournals.com | july-2017 phenomena to material science has been addressing by the scientific society at the nanoscale [11-13]. Nanoparticle doping technology provides a more convenient and flexible approach for the modification of liquid crystal materials and for designing new and improved devices based upon LCs. Moreover, different nanoparticle dispersion in liquid crystals has enhanced the physical properties of LCs. LCs act as tunable solvents for the dispersion of nanomaterials and LCs being anisotropic media, they provide a very good support for the self-assembly of nanomaterials in to large organized structures in multiple dimensions. Hence LC mediated self-assembly can be efficiently used to organize different kinds of nanomaterials in to soft and well defined functional super structures. Zinc oxide (ZnO) nanoparticles have become famous among researcher’s due to its use in various applications like gas sensors [14], chemical sensors [15,16], biosensors [17], superconductors [18], photo catalyst [19], optoelectronic devices [20-22], cosmetics etc. Rao et al. have published their results on different oxide materials, luminescent materials, polymers in their earlier studies [23-29]. ZnO is a wide band gap semiconductor having high optical transparency and luminescence in visible and near ultraviolet range of spectrum. Therefore, it is usually used in light emitting diodes and solar cells. Moreover, zinc oxide is environmental friendly and ease to synthesize. Experimental Synthesis of ZnO nanoparticles-high pressure combustion synthesis (High pressure autoclave) Take a known amount (3 g) of ZnO dissolved in 10 ml of conc. HNO3 solution and 10 ml H2O in 100 ml RB flask. The solution is stirred at ambient temperature for 1 h. Then add Urea (reducing agent/fuel) which decomposes macro-molecules into nanoparticles. Now add 10 mol% flux (Boric Acid) and stirred the solution for 0.5 h. Later keep the entire solutions into high pressure reactor at 120°C-130°C maintaining a pressure of 200 Kg/cm2 for 30 min. At this stage urea decomposes the entire solution in to ZnO nanoparticles. Then wash the resultant powder with methanol/water 5 to 10 times and dried and finally ZnO nanoparticles of size nearly 70 nm are obtained. These nanoparticles are further characterized by UV-Visible Spectroscopy and SEM experimental techniques. Dispersion of nanoparticles into the LC compounds For uniform dispersion of nanoparticles in LCs, the nanoparticles are first dissolved in ethyl alcohol, stirred well about 45 minutes and later introduced in the isotropic state of mesogenic material (8OBA and 12OBA) in quantity 0.5 wt% separately. After cooling, the nanocomposite 8OBA and 12OBA is subjected to study of the textural and phase transition temperatures using a polarizing optical microscope (SDTECHS make) with a hot stage in which the substance was filled in planar arrangement in 4 µm cells and these could be placed along with the thermometer described by Gray [29]. Textural and phase transition temperatures are studied after preparation of the sample and observations are made again to understand the stability of nanoparticles. The presence of citrate capped Au nanoparticles in 8OBA and 12OBA is studied by UV and SEM data and existence as well as size is determined by XRD technique. Periodic noise reduction using frequency domain filtering When equipment similar to the equipment that generated a degraded image is available, it is generally possible to determine the nature of the degradation by experimenting with various equipment settings. However, relevant imaging equipment availability is the exception, rather than the rule, in the solution of image restoration problems, and a typical approach is to experiment by generating PSFs and testing the results with various restoration algorithms. Finally, when no information is available about the PSF, we can resort to “blind de-convolution” for inferring the PSF. One of the principle degradations 2
www.tsijournals.com | july-2017 encountered in image restoration problems is image blur. Blur that occurs with the scene and sensor at rest with respect to each other can be modeled by frequency domain low pass filters. Another important degradation model is image blur caused by uniform linear motion between the sensor and scene during image acquisition. Periodic noise produces impulse-like bursts that often are visible in the Fourier spectrum. The principal approach for filtering these components is to use notch reject filtering. The general expression for a notch reject filter having Q notch pairs is Q k=1 H (u,v) H (u,v)H NR k k(u,v) Where Hk (u, v) and H-k (u, v) are high pass filters with centers at (uk, vk) and (-uk,-vk), respectively. These translated centers are specified with respect to the center of the frequency rectangle, (M/2, N/2). Therefore, the distance computations for the filters are given by the expression Dk (u, v)=[(u-M/2-uk)2+(v-N/2-vk)2]1/2 D-k (u, v)=[(u-M/2+uk)2+(v-N/2+vk)2]1/2 A special case of notch rejects filtering that notch out components along of the frequency axes also are used for image restoration. Results and Discussion Polarizing optical microscope Determination and characterization of these mesophases will provide very important information on the pattern and textures of the liquid crystals. The transition temperatures and textures observed by polarizing microscope in 8OBA pure is shown in FIG. 1(a-d) while that of with dispersed ZnO nanoparticles with concentration 0.5 wt% shown in FIG. 2(a-d) respectively. The thermal range of nematic phase is changed slightly due to the dispersion of nanoparticles and the textures of the phase’s changes by the self-assembly of nanoparticles. The DSC thermograms are shown in FIG. 3 to FIG. 6. The transition temperatures at the phase transformations determined through POM is shown in the TABLE 1. The compound 8OBA and 12OBA are brought from sigma-Aldrich, USA and used as such. For uniform dispersion of ZnO nanoparticles in 8OBA and 12OBA, the nanoparticles are first dissolved in ethyl alcohol, stirred well about 45 min and later introduced in the isotropic state of mesogenic material in the ratio of 0.5 wt% concentration separately. FIG. 1(a-d). POM textures of 8OBA+0.5 wt% ZnO. 3
www.tsijournals.com | july-2017 FIG. 2(a-d). POM textures of 12OBA+0.5 wt% ZnO. FIG. 3. DSC thermogram of 8OBA pure. FIG. 4. DSC thermogram of 12OBA pure. 4
www.tsijournals.com | july-2017 FIG. 5. DSC thermogram of 8OBA with 0.5 wt% ZnO nanoparticles. FIG. 6. DSC thermogram of 12OBA with 0.5 wt% ZnO nanoparticles. TABLE 1. Phase variants, transition temperatures, enthalpy values of 8OBA and 12OBA pure and with dispersed 0.5 wt% ZnOnanoparticles. S. No Compound DSC/ POM Scan rate Transition temperatures °C Thermal ranges I-N N-SmC SmC- Solid I 95.5 22.77 Solid I- solid II -- ΔN ΔSmC 1 8OBA pure DSC 20c/min ∆HJ/gm 144.2 3.16 105.56 3.42 38.64 10.06 POM 143.92 104.9 95.2 -- 39.02 9.7 2 8OBA+0.5 wt% ZnO DSC 20C/min ∆HJ/gm 143.15 5.96 104.37 3.10 93.73 28.12 -- 38.78 10.64 POM 143.4 103.7 95.2 89.2 39.7 8.5 5
www.tsijournals.com | july-2017 3 12OBA pure DSC 20c/min ∆HJ/g 138.8 1.49 132.8 7.91 97.3 81.03 -- 6 35.5 POM 138.1 130.4 96.4 -- 7 34 4 12OBA+0.5 wt% ZnO DSC 20c/min ∆HJ/g 129.22 120.9 86.39 65.33 8.3 34.51 POM -- 127.7 119.8 91.2 79.0 7.9 28.6 FTIR analysis As synthesized ZnO nanoparticles dispersed in 12OBA Compound is analyzed by using FTIR at room temperature. The compound is stable at room temperature, the IR frequencies in solid state which are correlated in bond with the pure bond 12OBA. The assigned bonds corresponding to the resultant frequencies from the spectra are tabulated. Due to the excitation of both molecular vibrations and rotations absorptions of electromagnetic radiation causes the formation of absorption bands in the IR spectra which are useful to explain the bonding interaction of the molecules. In both spectra exhibit a strong electromagnetic absorption at 1609.97 cm-1, 1599.63 cm-1 and 1256.26 cm-1, 1256.26 cm-1 corresponding to aromatic ring stretching. The absorption bands at 2915.53 cm-1 and 2918.77 cm-1 are corresponding to OH bond. The existence of OH bond vibration at 647.77 cm-1, 654.24 cm-1 and also represents the benzoic acids moiety due to their strong intensity and strongly supports the existence of 12OBA. The bond 843.70 cm-1, 843.70 cm-1 are assigned to stretching ring vibration at the out of plane. While dispersing the ZnO nanoparticles the intensity of the peaks are found to be decreased as shown in the FIG. 7 and TABLE 2. The intensity of 12OBAwith dispersed nanoparticles is found be decreases, this related to the change in dipole that occurs during the vibration. The vibrations that produce small change in dipole result in a less intense absorption than those that result in a relatively modest change in dipole. As we have taken the FTIR data in mid infra-red region, it is not possible to take the nanoparticle data. FIG. 7. FTIR of 12OBA pure and with dispersed 0.5 wt% ZnO nanoparticles. 6
www.tsijournals.com | july-2017 TABLE 2. Functional group intensities for 12OBA pure and with dispersed ZnO nanoparticles across the following wavelengths. S. No Wavenumer cm-1 Intensity for pure LC with ZnO nanoparticles 1 2915.53 0.8040 0.8389 2 1669.46 0.78778 0.8235 3 1609.97 0.7938 0.8167 4 1575.05 0.9094 0.9212 5 1508.45 0.9153 0.9339 6 1469.65 0.8856 0.9103 7 1298.29 0.7981 0.8210 8 1256.26 0.6885 0.7216 9 1168.96 0.8261 0.8499 10 843.7 0.8397 0.8686 11 766.75 0.8159 0.8686 12 720.84 0.9086 0.9221 13 693.39 0.9136 0.9280 14 647.77 0.8184 0.8380 Intensity for LC dispersed Functional group OH bond Benzoic acid Ring stretching dimer Aromatic ring structure CHOH bending Ring out of plane pplane Aromatic ring stretching CH out of plane C=O bending OH bond UV-visible analysis The UV-Visible analysis of 12OBA with 0.5 wt% ZnO nanoparticles is shown in FIG. 8. The peaks between 245 nm to 258 nm resemble the existence of ZnO nanoparticles in the LC compound. So, the UV-visible spectral study confirms the presence of Zno nanoparticles in the prepared nanodoped LC. FiG. 8. UV analysis of 12OBA with dispersed 0.5 wt% ZnO nanoparticles. 7
www.tsijournals.com | july-2017 SEM analysis SEM gives the magnified image of the surface of a material, topographical information and also gives the information regarding the composition of the elements in the material. The SEM images of ZnO nanoparticles and with the dispersion of 1 wt% ZnO nanoparticle in 12OBA is shown in the FIG. 9 to FIG. 12. FIG. 9. EDS data of ZnO nanoparticles. FIG.10. SEM image. 8
www.tsijournals.com | july-2017 FIG. 11. EDS data of 12OBA with image dispersed ZnO nanoparticles. FIG. 12. SEM image. Frequency domain filtering analysis in image processing The nanodispersed liquid crystal compound images collected from POM and observed that the images quality is very poor with respect to contrast. Frequency domain filtering technique is applied to enhance the images and the corresponding enhanced images are presented in this section (FIG. 13(a-d) to 16 (a-d)). FIG. 13(a-d). Texture of 12OBA+0.5 wt% ZnO (POM images). 9
www.tsijournals.com | july-2017 FIG. 14(a-d). Contrast enhanced images of 12OBA+0.5 wt% ZnO using image processing. FIG. 15(a-d). Texture of 8OBA+0.5 wt% ZnO (POM images). FIG. 16(a-d). Contrast enhanced images of 8OBA+0.5 wt% ZnO using image processing. 10
www.tsijournals.com | july-2017 Conclusion With the present results, we demonstrated the dispersion of ZnO nanoparticles in LC 8OBA and 12OBA changing of their textures, phase transition temperatures and shifts in vibrational bands by using polarizing microscope, differential scanning calorimeter and Fourier transform infra-red techniques respectively. The transition temperatures obtained from polarizing microscope are in good agreement with those obtained from DSC. The UV-Visible spectral study confirms the presence of ZnO nanoparticles in the prepared nanodoped LC. The presence of ZnO in LC 12OBA is also confirmed by the EDS data of SEM and the ZnO nanopartilces sizes are in the range of 50 nm-85 nm. To enhance the image quality, frequency domain filtering technique in image processing is used and the enhanced images are giving better contrast to identify the transition phases. Acknowlegement The Corresponding author Dr R.K.N.R. Manepalli (Dr M. Ramakrishna Nanchara Rao) is thankful to the UGC for grant 42- 784/2013 (SR). REFERENCES 1.Hayashi Y. In water or in the presence of water? Angewandte Chemie Int Edn. 2006;45(48):8103-4. 2.Tschierske C. Liquid crystal engineering-new complex mesophase structures and their relations to polymer morphologies, nanoscale patterning and crystal engineering. Chem Soc Rev. 2007;36(12):1930-70. 3.Shiraishi Y, Toshima N, Maeda K, et al. Frequency modulation response of a liquid-crystal electro-optic device doped with nanoparticles. Applied Physics Letters. 2002;81(15):2845-7. 4.Lynch MD, Patrick DL. Organizing carbon nanotubes with liquid crystals. Nano Letters. 2002;2(11):1197-201. 5.Dierking I, Scalia G, Morales P. Liquid crystal-carbon nanotube dispersions. J App Phy. 2005;97(4):044309. 6.Basu R, Iannacchione GS. Carbon nanotube dispersed liquid crystal: A Nano electromechanical system. Applied Physics Letters. 2008;93(18):183105. 7.Lagerwall JP, Scalia G. Carbon nanotubes in liquid crystals. Journal of Materials Chemistry. 2008;18(25):2890-8. 8.Russell JM, Oh S, LaRue I, et al. Alignment of nematic liquid crystals using carbon nanotube films. Thin Solid Films. 2006;509(1):53-7. 9.Basu R, Iannacchione G. Evidence for directed self-assembly of quantum dots in a nematic liquid crystal. Phys Rev E. 2009;106:124312. 10.De Jong WH, Borm PJ. Drug delivery and nanoparticles: Applications and hazards. Int J nanomed. 2008;3(2):133. 11.Reiss G, Hutten A. Magnetic nanoparticles: Applications beyond data storage. Nature Materials. 2005;4(10):725-6. 12.Scott JF. Ferroelectric Memories, Berlin, Springer. 2000;pp:191-206. 13.Gupta SK, Joshi A, Kaur M. Development of gas sensors using ZnO nanostructures. J Chem Sci. 2010;122(1):57-62. 14.Fan Z, Lu JG. IEEE Trans. Nanotech. 2005; 2:834. 15.Fan Z, Lu JG. Chemical sensing with ZnO nanowire field-effect transistor. IEEE transactions on nanotechnology. 2006;5(4):393-6. 16.Zhao Z, Lei W, Zhang X, et al. ZnO-based amperometric enzyme biosensors. Sensors. 2010;10(2):1216-31. 17.Sharma P, Gupta A, Rao KV, et al. Ferromagnetism above room temperature in bulk and transparent thin films of Mn-doped ZnO. Nature Mater. 2003;2(10):673. 11
www.tsijournals.com | july-2017 18.Bagabas A, Mohmed A, Aboud FA, et al. Room-temperature synthesis of zinc oxide nanoparticles in different media and their application in cyanide photodegradation. Nanoscale Res Lett. 2013;8:516. 19.Shao S, Zheng K, Zidek K, et al. Optimizing ZnO nanoparticle surface for bulk heterojunction hybrid solar cells. Solar Ener Mater Solar Cells. 2013;118:43-7. 20.Bhat SV, Govindaraj A, Rao CNR. Hybrid solar cell based on P3HT-ZnO nanoparticle blend in the inverted device configuration. Solar Ener Mater Solar Cells. 2011;95(8):2318-21. 21.Zhou Y, Eck M, Kruger M. Solar Cells-New Aspects and Solutions. 2011; pp:95-120. 22.Muntaz Begum Sk, Rao MC, Ravi Kumar RVSSN, et al. Cu2+ doped PVA passivated ZnSe nanoparticles- preparation, characterization and properties. J Inorg Organometa Poly Mater. 2013;23(2):350-6. 23.Rao MC. Growth and microstructural features of laser ablated LiCoO2 thin films. J Crys Growth. 2010;312(19):2799-803. 24.Rao MC. Fabrication of LiCoO2, LiTixCo1-xO2 and LiNixCo1-xO2 thin film cells for rechargeable lithium microbatteries. Optoelect & Adv Mater. 2011;5:85-88. 25.Rao MC. Grain size effect on the growth of LiCoO2 thin film cathodes. J Optoelect & Adv Mater. 2011;13:428-31. 26.Rao MC, Hussain OM. Microstructural and electrochemical studies on laser ablated LiNiO2 thin films. Optoelect & Adv Mater. 2011;13(2-4):1109. 27.Ravindranadh K, Rao MC, Ravikumar RVSSN. Optical and structural properties of undoped and Mn2+ doped Ca-Li hydroxyapatite nanopowders using mechanochemical synthesis. J Luminesce. 2015;159:119-27. 28.Rao MC, Hussain OM. Synthesis and electrochemical properties of Ti doped LiCoO2 thin film cathodes. J Alloys Compd. 2010;491:503-6. 29.Gray GW. Molecular structures and properties of liquid crystals. Academic Press. 1962. 12