Download
1 / 18
180 likes | 282 Views
TPOL Test Beam Telescope. Chris Collins-Tooth (ZEUS, IC-London). Outline. Test Beam setup of the Telescope and TPOL What is the Telescope and what does it do? What data was gathered? Analysis of the data Multiple Coulomb Scattering, Beam spread, and Telescope resolution Relative rotations

E N D
TPOL Test Beam Telescope Chris Collins-Tooth (ZEUS, IC-London)
Outline • Test Beam setup of the Telescope and TPOL • What is the Telescope and what does it do? • What data was gathered? • Analysis of the data • Multiple Coulomb Scattering, Beam spread, and Telescope resolution • Relative rotations • between parts of the Telescope • between the Telescope and the TPOL silicon • What can be done about these factors? • What does this tell us about the TPOL silicon? • TPOL silicon resolution • TPOL silicon efficiency • Summary
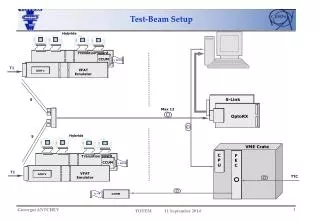
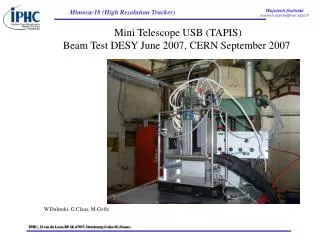
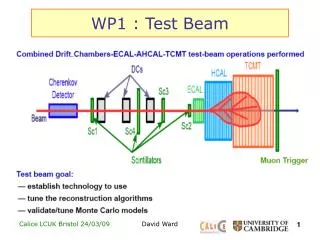
Test Beam setup TPOL • 6 GeV e- beam enters from left • e- beam passes through Telescope then moves into the TPOL • Telescope mounted as close to TPOL as possible on movable table • Telescope has 3 position sensitive detectors T1,T2 and T3 (Td was ‘dead’ material being used for a second experiment) Telescope
60 The Telescope P(%) 50 40 30 • Previously, degree of polarisation estimated using energy asymmetry in calorimeter (Calorimeter resolution ~1000 m) • Now measure polarisation using 80 m pitch Si • Something more accurate needed to probe TPOL silicon resolution - the Telescope. • 3 planes of 50 m pitch Si, with horizontal and vertical strips. • T1,T2,T3 detectors roughly 3cm × 3cm (TPOL silicon ~1 cm2) 20 10 0 -10 t(min)
The data • T1,T2,T3 used to predict Si strip to fire. • As expected, fitted line has slope =1 0.01 • Offset simply due to T1,2,3 being physically larger than TPOL Silicon • Width of data about fitted line gives indication of TPOL resolution
The width • Width =132.15 ± 2.93 m • TPOL Silicon strip pitch =80 m • Intrinsic resolution ~80/12 m -800 -400 0 0 400 800
Analysis of the data • Observed width does not relate directly to the TPOL resolution • Multiple Coulomb Scattering (MCS) of e- beam at T1,Td,T2,T3 and TPOL Aluminium Box • Finite resolution of the Telescope • e- beam not 100% collimated • Misalignments of the Telescope detectors T1,T2,T3 • Misalignments of the Telescope (as a whole) and the TPOL
Telescope internal misalignment • T1,T2 and T3 could all be misaligned with respect to each other. • Rotations would produce systematic shifts of ‘predicted minus actual’ strip firing from left-to-right • Most important are rotations about beam-axis (pictured). A 0.08o rotation would cause a shift of 1 strip across breadth of detector
‘Predicted minus Actual’ shifts for T3,T2 and T1 from LR T3 T2 T1 • Using T1,T2 to predict T3 (left) we observe a shift from left to right of approximately 50 microns
Correction of misalignment • Iterative process invoked • Rotating T3 by 0.27o flattened off all the plots (to within errors)
TPOL misalignment • The TPOL silicon had no vertical strips • Track through T1,T2,T3 used to predict vertical strip to fire to give indication of horizontal position of impact • No discernable shift observed before or after T3 rotation applied • Correction for rotations caused no discernable reduction in observed ‘width’
MCS, Telescope resolution and beam collimation • Simple Monte-Carlo simulation using PDG formula for MCS with gaussian width: s=(13.6MeV/cp) (x/Xo) (1+0.038 n [x/ Xo]) • Telescope resolution and beam collimation are small factors in comparison to MCS • Together, all these factors contribute ~102 m to the width • Subtracting in quadrature, the TPOL resolution obtained is (1322-1022) 83 m • But - MCS is not actually gaussian • Attempting to use GEANT to improve estimate
Error propagation T1 Td T2 T3 Al T4 (TPOL) m3 • Alternative approach to Monte-Carlo • Use errors introduced by MCS etc., and propagate them to the TPOL silicon • T4=T3+Z4m3+Z43+(Z4-ZAl)Al • Var(T4)=Var(T3)+Z42Var(m3)+Z42Var(3)+(Z4-ZAl)2Var(Al)+Z4Cov(T3,m3) • T3=T1-Z1m3-Zdd-Z22 • Var(m3)=(1/Z12)(T1-T3-Zdd-Z22) • Variances are calculated, (e.g. Var(T1,T2,T3)=2T1,T2,T3 =208 m) • T4=[Var(T4)]=120 m= Error on TPOL Si due to uncertainties in Telescope • Resolution of TPOL Si = [1322-1202]=55m m3 m3+3 +z
TPOL Resolution • From Monte-Carlo Simulation we obtain RTPOL 83 m • From Error Propagation we obtain RTPOL 55 m
TPOL Silicon Efficiency Ratio of hits NOT registering in TPOL • Telescope used to predict TPOL events • Efficiency is the ratio of: events with TPOL Silicon signal events predicted by Telescope • TPOL Silicon edges found by looking at ratio of hits not registering in the TPOL as a function of position • Log plot reveals edges where Telescope predicts TPOL hits but TPOL does not register • Horizontal edges at 13000 & 20000 m • Vertical edges at 11000 & 18000 m • Consistent with active area of Silicon Horizontal Position (m) Vertical Position (m)
Efficiency cuts • Using the edges from previous slide, we must remove predicted events from efficiency calculations where they miss the boundaries of the TPOL Si • Figures show • events predicted by the Telescope and registered by the TPOL (black) • For effect, events in red are added. They are predicted events which had no TPOL response, but the event was inside the opposite direction boundary, and so should have registered. • Clearly, the boundaries look correct.
Final Efficiency • With the positional cuts made, the efficiency of the TPOL silicon can be calculated • This is the ratio of : events with a TPOL silicon response all predicted events inside the boundary • The efficiency is uniform across the detector, at ~97.8%
Summary • Misalignments, Coulomb Scattering and other factors contribute significantly to observed width of 132 m. • TPOL Silicon resolution TBA but preliminary studies suggest 55 and 83 m • TPOL Silicon efficiency uniform at 97.8%