Download

1 / 23
230 likes | 317 Views
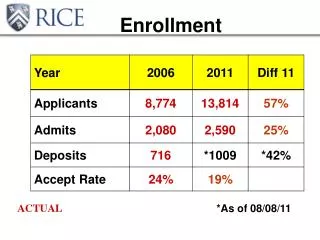
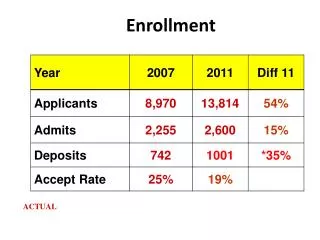
Internal Enrollment Trends. Some Important Patterns of Our Enrollment to Guide our Thinking. Aggregate Enrollment Patterns. Data from Fall SIRS Reports for Last Five Years New Student Number Is Stable Continuing Student Number Increasing Graduate Number Dips and Returns.

E N D
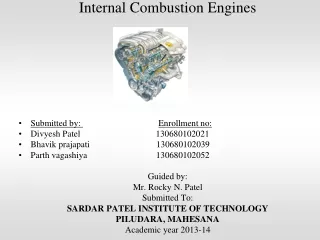
Internal Enrollment Trends Some Important Patterns of Our Enrollment to Guide our Thinking
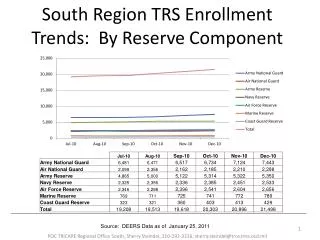
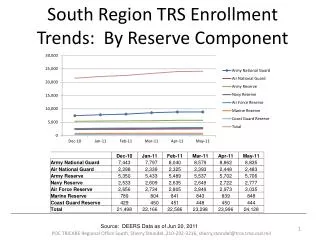
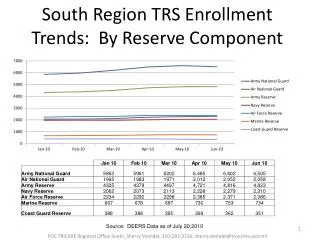
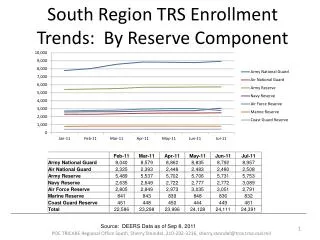
Aggregate Enrollment Patterns • Data from Fall SIRS Reports for Last Five Years • New Student Number Is Stable • Continuing Student Number Increasing • Graduate Number Dips and Returns
Brief Summation • Graduate Enrollment Returning to Its High Point in 1998 • UG Enrollment Reflects Retention Efforts
Retention Complex • Although # of New Students Stable • Rejections of Applications Increased • Average SAT Score Has Gone Up • Number of Suspensions Down • Number in Learning Support Down • Quantity Constant, Quality Up
Improved Quality • Handouts on SAT • Suspensions • Rejections
Retention Complex • As First Year Retention Has Increased, Retention Overall Has Increased • Thus, Higher Demand for Classes in Upper Division Areas
Running Out of Room • Our Successes Have Created Crowded Conditions • Numbers Committee Problem –Core Seats – Now a Larger Problem
Occupancy Rates • Term for Enrollment Capacity • A Section at Midterm with Five or Fewer Available Seats is Full • Percentage of Full Sections to Total Sections = Section Occupancy Rate • Or Percentage of Seats Taken to Seats Offered = Seat Occupancy Rate
Graphs of Occupancy Charts COAS, COE, RCOB LD = Lower-Division Students UD = Upper-Division Students Grad = Graduate Students Section OR = Section Occupancy Rate
Not All Areas Are Crowded Equally • Upper-Division Courses Have Some Room to Grow • Yet Not All Departments Follow Same Pattern
Department and Section Seat Occupancy • See Handouts of Charts for Fall 02 for All Three Colleges
Increased Class Size • As Demand Has Increased • So Has Class Size • But Not As Much As Thought
Majors Distribution • Handout on Returning Students
Tentative Conclusion • Implications