Download
1 / 30
300 likes | 449 Views
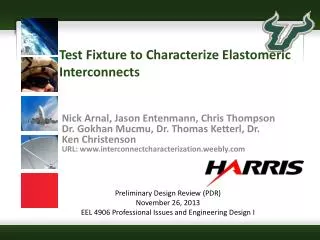
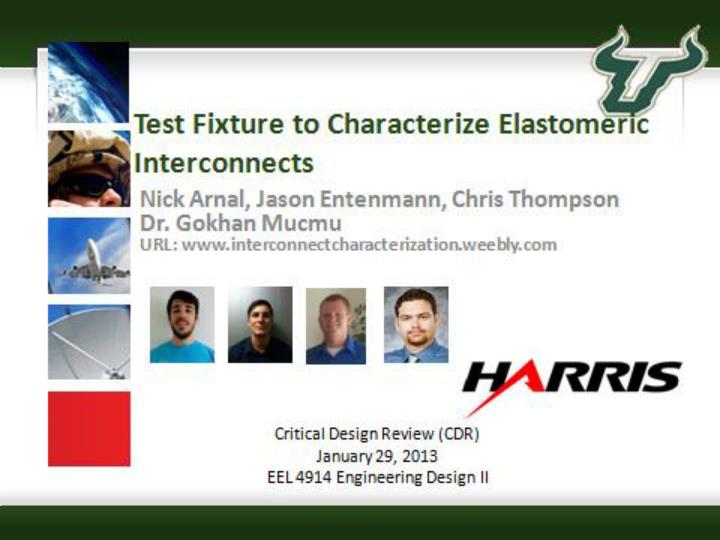
Test Fixture to Characterize Elastomeric Interconnects. Nick Arnal, Jason Entenmann , Chris Thompson Dr. Gokhan Mucmu URL: www.interconnectcharacterization.weebly.com. CHRIS ADD PIC. Critical Design Review (CDR ) January 29, 2013 EEL 4914 Engineering Design II. Problem Statement.

E N D
Test Fixture to Characterize Elastomeric Interconnects Nick Arnal, Jason Entenmann, Chris Thompson Dr. GokhanMucmu URL: www.interconnectcharacterization.weebly.com CHRIS ADD PIC Critical Design Review (CDR) January 29, 2013 EEL 4914 Engineering Design II
Problem Statement • Our task is to a characterize elastomeric interconnectsfor Harris Corporation • Measure S-parameters, continuity, and contact resistance • Characterize two different styles of elastomeric interconnects • All while undergoing 500 cycles of temperature cycling (-55°C to 125°C) Temperature Cycle Profile Sample Elastomeric Connector
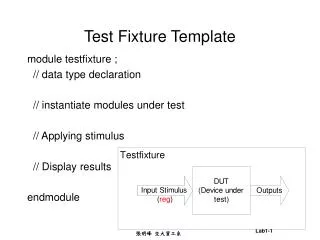
Design Approach • We are designing a test fixture with multiple circuit boards to be placed in a temperature chamber • Elastomeric connectors conduct when compressed 10-15%. They will be sandwiched between a pair of circuit boards with RF cables running to outside of the oven. • 2-3 elastomeric connectors per circuit board Example of Test Fixture in Oven
S-parameter Measurements • A 20GHz Agilent 8720ES VNA will be used • The S-parameters will be measured for one connector at a time • Cables pairs will be interchanged by hand • The VNA will be calibrated up to the cable mount • Characterized cables will be removed from the measurement by de-embedding (next slide)
Continuity Measurements • Continuity for each connector is determined by a comparator circuit (see next slide) • Digital HIGH sent to Arduino if RCONN>1000Ω (discontinuity) • Digital LOW sent to Arduino otherwise (continuity) • Sample rate = 10kHZ per connector (10,000 samples/second)
Continuity Test Circuit Channel • Max current through connector • (RCONN=0, VS=5V) • Discontinuity Trigger voltage (RCONN≥1kΩ) • R1/R2 Voltage divider sets VREF • Max current draw from Vs ≈ 2mA / channel • LM339 response time - 1.3µs
Temperature Sensing Circuit • LM35 will be mounted on the board to verify the temperature • -0.55V to 1.25V output shifted to 0.9V to 4.5V by the op-amp summer
Arduino Timing Diagram • The Arduino will process both the continuity test and the temperature • Continuity test results (# of discontinuities out of 10,000 per connector) and temperature recorded from Arduino to computer every second • Communication process takes about 2ms • This cycles continuously repeats
RF Circuit Design • RF Circuit Design Requirements • Minimal design for truest results of connectors/interconnects • Frequency Range: 0.5 to 18GHz • Temperature Design: -55 to 125 C • Compression requirements: 15% +/- 5% (For Interconnect #1 and #2)
RF Circuit Design • Software / Calculations • ANSYS HFSS v.15 Simulation Software • Full circuit design and simulation in frequency ranges • LineCalc • Transmission line calculations • ADS • AutoCAD and Gerber circuit files for fabrication
Circuit Design • GPO Connector / Interconnect Specifications • Three piece connection design • Impedance: 50 Ohms • Frequency: DC to 40GHz • Temperature Design: -65 to 165 C
Circuit Design • Interconnect #1 and #2 Specifications Custom Interconnects per Harris’ requirements • Compression Rating: 15% +/- 5% • Designed for frequency and temperature ratings • Correct alignment for true results PCB Heat Sink (Spacer) PCB Interconnect
Circuit Design • Design and Simulation: GPO • Simple two layer, two board design • Microstrip lines on the inner side of boards • Stand-offs will be used to hold the system together
Circuit Design • Design and Simulation: GPO • Transmission Results, S21
Circuit Design • Design and Simulation: GPO • Reflection Results, S11
Circuit Design • Completed Design: GPO • Two connector/interconnect setups
Circuit Design • Design and Simulation: Interconnect #1 and #2 • Simple two layer, two board design • Micro-strip lines on outer sides of boards • Aluminum Spacers are used on inside to act as heat-sink and alignment tool for interconnects PCB Heat Sink (Spacer) PCB Interconnect
Circuit Design • Design and Simulation: Interconnect #2 • Transmission Results, S21
Circuit Design • Design and Simulation: Interconnect #2 • Reflection Results, S11
Circuit Design • Design and Simulation: Interconnect #1 • S11 and S21 Results
Circuit Design • Completed Design: Interconnect #1 • Three interconnect setup
Contact Resistance • Using a typical Multimeter • 4 probe test • Only on one type of connector being tested • Boards are same size as other test boards • Wires soldered directly to board • DC test
Software and Equipment Design Tools • Board design • HFSS, Pspice • Fixture design • SolidWorks • Data processing and control • Programming in C# • MATLAB for data processing • Measurement & Test Equipment • Agilent 20GHz VNA • Thermotron Temperature Chamber • 4-point Multimeter • Arduino MEGA
Action Items Test Fixture Assembly and Test Readiness Review (TRR) – February 26th • Fabricate and build test fixture • Manufacture all test boards • Run software for one full cycle to validate functionality • Test fit fixture and boards, test for contact resistance Product Testing – February 26th – April 16th Analyze Results / Final Report– April 16th – May 14th
Summary/Accomplishments • Measurements • Test cable has been characterized, more have been ordered • MATLAB de-embedding program written and working • Continuity test written on Arduino • Temperature sensor circuit built • Software • Fully automated program to run tests and alert team of anomalies in the system during test has been created
Summary • Circuit Design • GPO, interconnect #1 and #2 • Boards and interconnects designed in HFSS • Boards and interconnects simulated from 0-20GHz • Quotes from multiple companies for board fabrication • Fixture Hardware • Fixture designed in SolidWorks and CTE and vibrational testing has been simulated