Download
1 / 1
10 likes | 106 Views
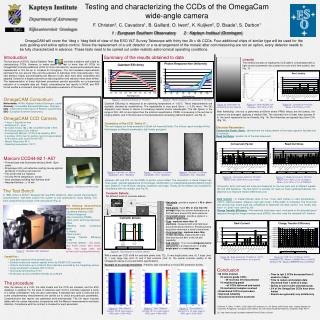
This project aims to thoroughly test and characterize the CCDs of the OmegaCam wide-angle camera. With enhancements to the test bench, it facilitates efficient testing of over 40 CCDs for OmegaCam. The project ensures each detector is fully characterized under realistic astronomical conditions. The results show excellent linearity, quantum efficiency, and low non-linearity for the CCDs. The project involves measuring various parameters like conversion factor, read-out noise, and PRNU effects. Detailed reports enable easy sharing and evaluation of the results.

E N D
F. Christen2, C. Cavadore1, B. Gaillard, O. Iwert1, K. Kuijken2, D. Baade1,S. Darbon1 1 : European Southern Observatory 2 : Kapteyn Instituut (Groningen) OmegaCAM will cover the 1deg x 1deg field of view of the ESO VLT Survey Telescope with thirty two 2k x 4k CCDs. Four additional chips of similar type will be used for the auto guiding and active optics control. Since the replacement of a unit detector or a re-arrangement of the mosaic after commissioning are not an option, every detector needs to be fully characterized in advance. These tests need to be carried out under realistic astronomical operating conditions. Testing and characterizing the CCDs of the OmegaCam wide-angle camera Introduction The test bench of ESO's Optical Detector Team ( ODT ) provides a platform well suited for characterizing CCDs. However, to make easier the test of more than 40 CCDs for OmegaCAM (including additional CCDs for other instruments), several enhancements were implemented in this set-up to increase its throughput. The last hardware improvements optimized the turn-around time and the precision of individual CCD characterization. Two new detector heads accommodating two Marconi CCDs each have been assembled and adapted. Scripts for a largely autonomous data acquisition and reduction have been written. The implementation of these high-level procedures permits essentially an un-supervised reduction of a complete data set. Finally, comprehensive test reports in HTML and PDF format enable a convenient sharing and comparative evaluation of the results. Summary of the results obtained to date Linearity The method consists of reading the CCD while it is illuminated with a light source (assumed to be constant on such short time scales), see Fig. 13. • OmegaCAM ConsortiumNetherlands :NOVA, Kapteyn Instituut Groningen, Leiden • Germany :Universitäts-Sternwarte München, Göttingen. • Italy :Osservatorio Astronomico di Padova, Capodimonte. • ESO :European Southern Observatory. • OmegaCAM CCD Camera • 1 deg x 1 deg field of view • Sampling 0.2’’ / pixel • 32 CCDs mosaic 16k x 16k (CCD EEV 44-82 1-A57) • 40 Science grade CCDs ordered • Contract with Marconi : CCDs to be tested by ESO • 4 auxiliary CCDs (two for guiding, two for image analysis for the active optic control for the VST) • Mosaic filling factor 93 % • Operating temperature -120°C Figure 4 : Quantum efficiency of 19 CCDs Figure 5 : Photon response non-uniformity of 19 CCDs Quantum Efficiency is measured at an operating temperature of -120°C. These measurements are regularly checked by recalibrations. The repeatability is very good (Error : ± 0.2% max). The QE dispersion from device to device is increasing towards shorter wavelengths. The QE figures in the range of 300- 400 nm are higher than the minimum specification. PRNU is increasing in the red due to fringing effects, and in the blue due to the backside laser annealing (diamond pattern, see Fig. 6) Figure 13: Illumination for computing the non-linearity Figure 14 : Peak-to-peak non-linearity= 1.5%, Rms= 0.4% Figure 15 : Linearity for 19 CCDs, Mean= 0.27% Rms= 0.15% After flatfielding ( the test is performed at 600nm where PRNU effects are the lowest), the columns are averaged, applying a median filter. The residuals from a linear least-squares fit to the result represents the non-linearity (Fig. 14). Non-linearities are typically less than 0.3% (Fig. 15). Cosmetics of the CCD “Indus II” : The next images are three examples of 2kx4k full frame flat fields. The full test report includes 40 flat field images at different wavelengths, light levels and gains. Electrical Parameters Conversion Factor (Gain) : derived from the measurement of the mean signal of flat field and its variance. Read Out Noise : spatial rms of the bias measured. Figure 1 : The OmegaCAM Camera • Marconi CCD44-82 1-A57 • Thinned back-side illuminated devices 2kx4k 15μm • pixels. • Single-layer Hf02 anti-reflective coating insures optimal sensitivity in the blue and near UV. • Two serial read-out registers • On-chip Pt100 temperature sensor • Invar package providing high flatness level • Required flatness : ± 10 mm Figure 6 : Flat field ( λ= 350nm, bandwidth= 5nm, 1500ADU) Figure 7 : Flat field ( λ= 600nm, bandwidth= 5nm, 1500ADU) Figure 8 : Flat field ( λ= 900nm, bandwidth= 5nm, 1500ADU) Figure 16 : Conversion factor for 19 CCDs, Mean= 0.53 e-/ADU Rms= 0.03 e-/ADU Figure 17 : Read-out noise for 19 CCDs, Mean= 2.9 e- Rms= 0.4 e- at 50kpix/s Mean= 4.4 e- Rms= 0.7 e- at 225kpix/s Between 420 and 870 nm the PRNU is photon noise limited. The acquisition of these images has three goals : general appearance of the images, identification of unexpected/expected defects (bright spot, patterns, 512x1K block stitching, scratches) and traps. Finally, all the defects are recorded for compliance with the contract (see Fig. 9). Conversion factor and read-out noise are measured for the two ports and at different speeds (50 and 225 kpixels/s). The test bench is actually not read-out noise optimized because the objective is to measure relative differences only. Figure 2 : Two Marconi 44-82 CCDs The Test Bench In 1996, Amico & Böhm[1] designed the new ESO testbench. After several improvements (automatization, high-level scripts) this system is now optimized for mass testing. The main components are shown in the next picture (Fig. 3). Cosmetic Defects : Six different kinds of cosmetic defects : Dark Current : A median-filtered stack of five 1-hour dark frames is used (temperature : -120°C, read out speed : 50kpix/s, high gain mode : 0.55e-/ADU) is computed. The horizontal and vertical over scans pixel are considered to determine the dark current. It is mostlyless than 1 e- / pixel / hour (see Fig. 18). Charge Transfer Efficiency : Two methods have been used, one based on the extended pixel response through the image overscan area (EPER), the other used the standard Fe55 method. • Hot pixels : provide a signal of > 60 e- /pixel / hour. • Dark pixels : have 50% or less than the average output for uniform illumination at a flat field level around 500 photo-electrons. • Very bright pixels : provide a signal of > 200000 e-/pixel/hour. • Trap :captures more than 10 electrons, measured with a flat field level around 500 photo-electrons. Pocket pumping acquisition technique is used to trace them. • Very large trap :captures more than 10 000 electrons, measured with a flat field level around 90% of the full well capability. • bad column : 10 or more contiguous hot or dark pixels in a single column or a very bright pixel or a very large trap. • The following measurements are routinely performed : • Quantum efficiency (QE) • Photon Response • Non Uniformity (PRNU) • Dark (short and long exposure) • Bias • Readout noise, conversion factor • Linearity • Dark current • Charge Transfer Efficiency (CTE) • Cosmetic defects :(hot pixels, very bright pixels, dark pixels, traps, very large traps bad columns and coating blemishes) Figure 3 : The ESO CCD Testbench Figure 9 : Total balance of cosmetic defects With a mean per CCD of 66 hot and dark pixels (rms: 72) , 5 very bright pixels (rms: 4), 3 traps (rms: 3), 1 very large trap (rms: 2) and 2 bad columns (rms: 2), the overall cosmetic quality of the Omegacam device is very well within specifications. • Capabilities : • Long dark exposure time (several hours) • Several modes and readout speeds driven by FIERA CCD controller • Uniform illumination up to a field of 20cm diameter provided by the integrating sphere • Large wavelength coverage (300-1100nm) • Good spectral sampling (1nm) • All devices can be controlled remotely by software Figure 18 : Dark current for 17 CCDs at -120°C, Mean= 0.7 e-/pixel/h Rms= 0.6 e-/pixel/h Figure 19 : CTE for 17 CCDs at -120°C, Horizontal CTE : Mean= 0.999997 Rms= 0.000003 Vertical CTE : Mean=0.9999995 Rms=0.0000002 Example of an unexpected defect : Parasitic light injected by on-chip ESD protection diodes. • Conclusion • 88 CCDs ordered 40 science grade CCDs • - 29 received, 29 characterized • 16 engineering grade • - all CCDs delivered and tested • 32 mechanical samples received • Streamlined CCD test procedure • Improved reliability • Accuracies have been assessed • Time to test 2 CCDs decreased from 2 weeks to 3 days • Time to reduce and analyze data shortened from 1 week to 2 days • Ability to test 2 CCDs simultaneously • 3/4 of the OmegaCam CCDs have been tested • Results are generally very satisfactory The procedure After the delivery of a CCD, the data sheets and the CCD are checked, and the ESO database is updated. For the ease of reference each CCD is internally assigned a name of a stellar constellation; they are also used below. A standard test cycle is executed and some complementary measurements are carried out to check any particular parameters. Comprehensive test reports are generated semi-automatically. The full report includes tables with the values measured, comparisons with the Marconi measurements and basic statistics. Compliance with the contract is checked for each parameter. [1] Amico, P., Böhn, T. (1997) : ESO’s New CCD testbench. In J. W. Beletic and P. Amico (eds) : Optical detectors for astronomy, Astrophysics and space science library, Vol. 228, Kluwer Academic Publishers, Dordrecht, Page 95-114 Figure 10 : Bias 50kpix/s, binning 15x15, color scale in ADU, gain= 0.55e-/ADU Figure 11 : Bias 225kpix/s, binning 15 x 15, color scale in ADU, gain= 0.55e-/ADU Figure 12 : Bias 625kpix/s, binning 15 x 15, color scale in ADU, gain= 0.55e-/ADU [2] : http://www.eso.org/~ccavador/testbench/Prism/CCDtest-US.html