Download
1 / 3
40 likes | 174 Views
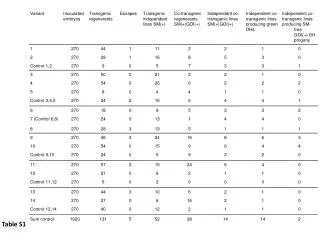
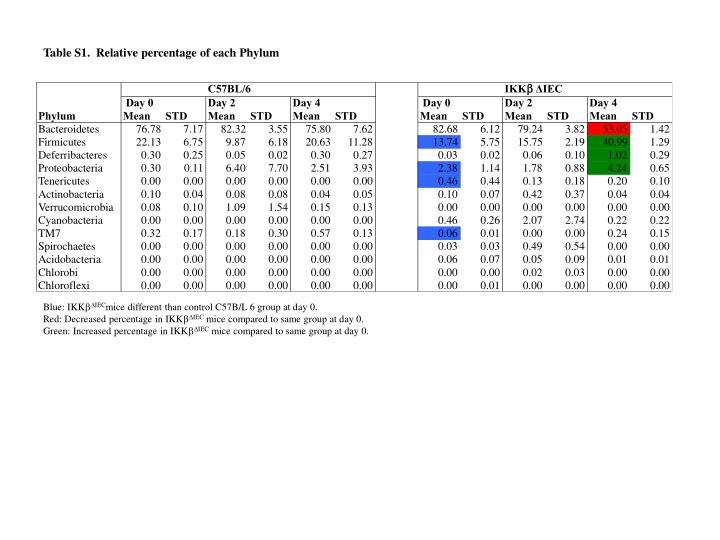
Table S1. Relative percentage of each Phylum. Blue: IKK b IEC mice different than control C57B/L 6 group at day 0. Red: Decreased percentage in IKK b IEC mice compared to same group at day 0. Green: Increased percentage in IKK b IEC mice compared to same group at day 0.

E N D
Table S1. Relative percentage of each Phylum Blue: IKKbIECmice different than control C57B/L 6 group at day 0. Red: Decreased percentage in IKKbIEC mice compared to same group at day 0. Green: Increased percentage in IKKbIEC mice compared to same group at day 0.
Table S2. Relative percentage of bacteria classes Blue: IKKbIECmice different than control C57B/L 6 group at day 0. Red: Decreased percentage in IKKbIEC mice compared to same group at day 0. Green: Increased percentage in IKKbIEC mice compared to same group at day 0.
Table S3. Relative percentage of bacteria orders Blue: IKKbIECmice different than control C57B/L 6 group at day 0. Red: Decreased percentage in IKKbIEC mice compared to same group at day 0. Green: Increased percentage in IKKbIEC mice compared to same group at day 0.