Download
1 / 7
70 likes | 176 Views
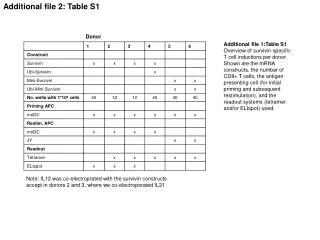
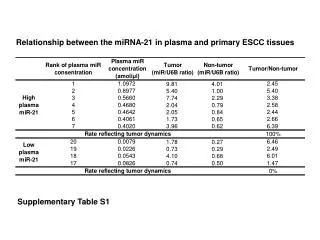
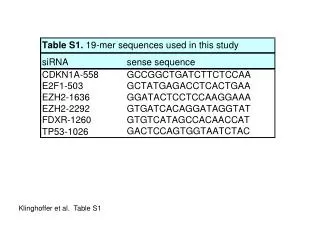
(Table S1). B. A. B. E. F. anterior. C. E. posterior. F. (Figure S1). ON. lCa. lCa. m. lo. SOG. PB. C. D. E. D. lCa. CC. Pe. CC. 1.E+02. 1.E+01. 1.E+00. 1.E-01. Relative Kakugo content. 1.E-02. 1.E-03. 1.E-04. days. 0. 1. 4. 6. 9. 14. (4). (3). (3).

E N D
B A B E F anterior C E posterior F (Figure S1) ON lCa lCa m lo SOG PB C D E D lCa CC Pe CC
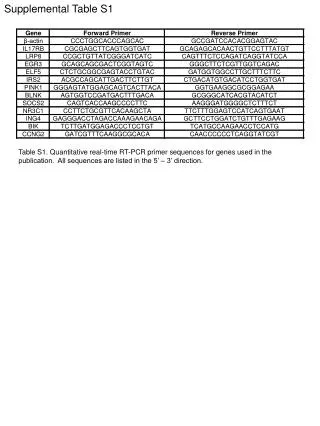
1.E+02 1.E+01 1.E+00 1.E-01 Relative Kakugo content 1.E-02 1.E-03 1.E-04 days 0 1 4 6 9 14 (4) (3) (3) (3) (3) (3) A 120 (Figure S2) 100 80 Survival rate (%) 60 40 20 0 0 1 2 3 4 5 6 7 8 9 days B
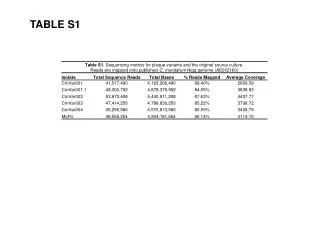
A ON lCa CB lCa m lo OC OES D lo m SOG C mCa mCa lCa lCa m CB lo lo OES ON m MB MB CB SOG lCa lCa lo lo m CB m lo AL OES AL lo m SOG B (Figure S3)
KV PBS actin P N KV DWV SBV ABPV KV + + - - actin P N DWV SBV ABPV PBS (-) F (+) A actin KV P N DWV SBV ABPV A (Figure. S4) B C D
(Figure. S5) Uninfected brains Kakugo GB10708 KV infected brains
(Figure S6) 101 100 10-1 Relative expression level of GB10708 10-2 10-3 10-4 days 0 1 4 6 9 14 N (KV) (4) (3) (3) (2) (3) (3) N (PBS) (3) (2) (3) (1) (3) (3) N (NI) (5) (2) (3) (2) (3) (4)