Download
1 / 43
430 likes | 516 Views
HSA, Dropouts, Graduation and AYP. Report to the Board of Education October 25 , 2011. High School Assessments. Class of 2011 How they met requirements. Special Education Certificates Passed all four Combined score Bridge Waiver. Class of 2011 How they met requirements. Completers.

E N D
HSA, Dropouts, Graduation and AYP Report to the Board of Education October 25, 2011
Class of 2011How they met requirements • Special Education Certificates • Passed all four • Combined score • Bridge • Waiver
Class of 2011How they met requirements Completers Non-Completers Enrollment Not Met-HSA Only 0 Passed 4 -42,938 Sept. 201060,555 Combined Score – 9360 Not Met-Other 3063 Dropouts 1821 Bridge - 5350 Waiver - 133 June 201163,605 Non-Grads without HSA requirement - 1157 Graduates Entering Prior to 2005 - 226 Total Diplomas - 58,753 Total -4220 SpEdCertificates - 722 Total Completers - 59,377
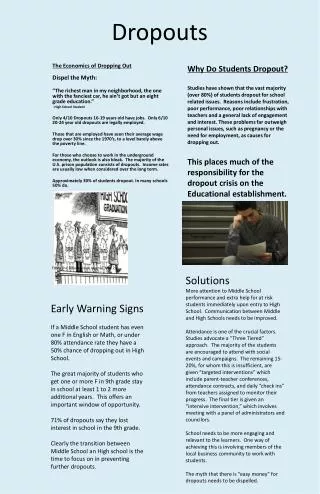
Non-Grads: A Closer Look Total Non-Grads:4220 • Working toward Special Ed Certificates: 1103 • Entered prior to 2005 (no HSA requirement): 54 Breakdown for Non-Grads Responsible for HSA Requirement
Class of 2011: 133 Waivers 2009 2010 2011
Changes for 2012 • Elimination of government requirement • New combined score is 1208 • Students who took government previously can use their score to help them meet requirements.
Graduation Rate “Leaver Rate” • No longer used for accountability • Counts all graduates, not just those who graduate in 4 years • Does not follow a Grade 9 cohort • Only measure with trends
Changes for 2011 • Implementation of cohort graduation rate for AYP • “On-time” graduates • Report 4 and 5-year rate for each cohort • Requires “lagged” rate (using Class of 2010)
Definition : Four-Year Adjusted Cohort Rate The number of students who graduate in four years with a regular high school diploma divided by the number of students who form the adjusted cohort for that graduating class. • Follows a cohort, or a group of students, who begin as first-time ninth graders in a particular school year. • For high schools that start after grade nine, the cohort is calculated based on the earliest high school grade.
Difference Between Current and Cohort Drop Out Rates Annual Event Rate Adjusted Cohort Rate Requires an LDS (4 years of data) Reflects cumulative drop outs across a 4 and 5 –year period from a cohort group entering Grade 9 at the same time Students are only counted once (final status) • Does not require an LDS (1 year of data) • Reflects all drop outs across grades 9-12 in a given school year • Reports every “event” of drop out: students can be counted twice • A drop out can also count as a graduate
Other New Features • Cohort drop out rate includes as drop outs • Students who do not continue from the end of one school year to the beginning of the next (cross summer) • Any student classified as a transfer who cannot be verified as enrolled somewhere else • Non-graduates at the end of Year 4 who do not re-enroll in Year 5.
What is “AYP” • Adequate Yearly Progress – sufficient progress toward the goal of 100% proficient by 2014 • Determination of school success based on No Child Left Behind • Uses MSA results and graduation rate • Schools must meet a yearly target (AMO) • Must meet target for each of 10 subgroups
Challenges to Achieving AYP • Target rises each year: AMOs
Challenges to Achieving AYP (cont.) • Confidence interval shrinks each year • All subgroups must achieve targets • Subgroups with 5 students or more counted • This year we have 10 subgroups instead of the 8 we have had in the past • Students receiving special services • USDE projected in March that 80 percent of schools would fail to make AYP
AYP Results- 2011 High Schools • 3 schools exited school improvement • 79 schools are in school improvement • 41 more than in 2010 • 44 schools missed AYP for the first time • Special education subgroups account for 39 percent of schools not meeting AYP because of only one subgroup.
AYP Breakdown – 2011 All Schools * Percentage is of total number of schools
AYP Results- 2011 All Schools • Of 1376 schools, 760 (55%) met AYP • 11 schools exited school improvement • 123 more schools are in school improvement now than in 2010
HSA and Graduation Questions and Discussion