Download
1 / 34
340 likes | 464 Views
Determining AYP. What’s New Step-by-Step Guide September 29, 2004. AYP: What’s new?. AYP Determinations for 03-04 Denominator For AYP Alternate Standards Definition of Economic Disadvantage Counting ELL student test scores Identification Report Card Revisions.

E N D
Determining AYP What’s New Step-by-Step Guide September 29, 2004
AYP: What’s new? • AYP Determinations for 03-04 • Denominator For AYP • Alternate Standards • Definition of Economic Disadvantage • Counting ELL student test scores • Identification • Report Card Revisions
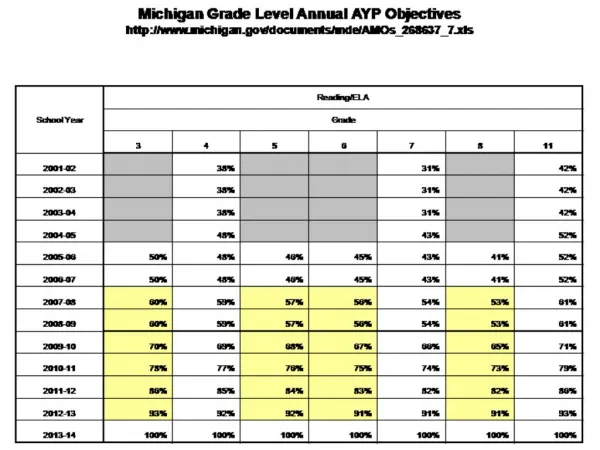
AYP Determinations for 03-04 • Same targets (achievement targets in 04-05 will be 50% in ELA and 49% in Math) • 02-03 grad data for economically disadvantaged and ELL groups reported • Attendance not lagged • Writing responses in Spanish count as meeting standard for AYP for qualified students - Numbered Memo 16-2003-04
New Denominator For AYP and Assessment Reports • No longer answer sheets returned • Enrollment as of May 1 (Participation) • Participation – ALL students enrolled • Performance - Highest score of students enrolled for FAY • Spring Participation Collection on May 3 • Numbered Memo 25-2003-2004
Alternate Standards • New (Dec.) Guidance From USDoE • Adopted by State Board in March for Extended Assessments and CLRAS
Alternate Standards • No more than 1% of student tests used to determine AYP for a district may meet alternate standards. • No Change in Choice of Test for Any Student (IEP process). • Numbered Memo 023-2003-04
Economic Disadvantage • U.S. Departments of Education and Agriculture Allow Use of Free and Reduced Lunch Status with strict confidentiality requirements • Numbered Memo 143-2002-03 • May 15 Collection
ELL Student Test Scores • USEd announcement February 19th • Scores of students during first year in U.S. not counted for performance • Reading and writing assessments not required during first year in U.S. • Transitioning students remain in LEP group for two years
Identification for School Improvement • Only Title I schools not meeting AYP for two consecutive years in an area (ELA, Math, Other Indicator) are identified for School Improvement
District AYP • USDoE recently indicated that it would approve using grade span (elementary, middle, high) data to determine 03-04 district AYP. • Districts would be identified for improvement only if they didn’t meet AYP targets in the same content area at each grade span two years in a row. • ODE is investigating the feasibility of adopting this change. • More information to follow.
Report Card Update • November 10 release date • No significant changes to formula • Detail sheets part of data validation • Display of science assessment results on detail sheets • Review of report card policy and formulas through February for 04-05 and 05-06 cards
Data Collection 2004-05 • Rolling validation • Consolidated Student File Format
AYP Step by Step • AYP “Tests” • Participation • Performance • Status • Safe Harbor • Other Indicator
English/Language Arts Total Students w/ Disabilities Limited English Proficient Poverty American Indian Asian African American Hispanic White Multi-Ethnic Mathematics Total Students w/ Disabilities Limited English Proficient Poverty American Indian Asian African American Hispanic White Multi-Ethnic AYP Tests for Each Subject and Subgroup
Minimum N for each “test” • Participation – 40 expected tests in content area over two years • Performance -- 42 tests in content area over two years (If total school population has fewer than 42 scores, additional data or methods are used to determine AYP.) • Other indicator – 84 students enrolled over two years combined
Participation • 95% Criteria • Participation = Number of valid test scores from all students enrolled in the school on May 3, 2004 divided by (The expected number of tests - the number of students without test scores that were not enrolled during the testing window(s) for the assessment – home schooled – district SpEd)
Academic Performance • Criteria • ELA: 40% (50% for 04-05) • Math: 39% (49% for 04-05) • Target met if achievement within margin of error. • Performance = Number tests met/ number of tests from students enrolled for a full academic year • Scores from first year LEP students excluded • 10th grade MPS results for 03-04 excluded
Achievement Safe Harbor • Academic Growth • Reduce the percent not meeting by 10% • Example: • If group’s 2003 achievement (single year of data) = 27%, the percent not meeting is 73%. The growth target is 7.3% increase or an achievement level of 34.3% in 2003. • AND must meet other indicator
Other Indicator • Graduation Rate for High Schools • Federal Formula Required in Definition • Grad rate = grad/(grad + dropouts) • Standard Diploma Only • 68.1% Criterion • Attendance for All Other Schools • 92% Criterion • 2 Years Data Used, but graduation is lagged
How AYP Tests Are Applied: No N > 40 ? Yes Participation AYP No > 95%? Yes District N > 42? No Method Yes Safe Status Harbor AYP No No Target? Target? Yes Yes - Other AYP No Indicator?
AYP: Key Points • Conjunctive Model • A school meets AYP only if each and every subgroup is successful in each subject. • Fundamentally different from the Oregon School Report Card, which combines all data into a single, overall rating.
AYP: Key Points (continued) • There will be significant differences in the achievement levels among schools not meeting AYP. • Schools and districts will have to analyze the data to determine appropriate responses to not making AYP.
What Happens After Preliminary Designations? • Review period – through October 14 • District corrections to collections and test records • Compliance with 1% cap • AYP Substantive appeals by districts • District Preliminary AYP - October 1 target • Final Designations on School and District Report Cards – November 10
03-04 Preliminary AYP Results • 66% of schools met AYP • 76% of elementary and 24% of high schools met • 82% of Title I elementary and 48% of Title I high schools met • 38 Title I schools are identified for school improvement • 110 schools did not meet participation
NCLB Accountability • Single accountability system required • Required actions for Title I schools and districts that do not make AYP in the same content area for two consecutive years • Accountability for non-Title I districts – restricted use of SRSA funding and REAP-Flex
Accountability • Revise SIP and submit to ODE – schools with “low” and “unacceptable” overall ratings on school report card • Revise SIP and submit to district – schools not making AYP in the same content area for two consecutive years
Resources • Documents, tools, guidance • www.ode.state.or.us/nclb • www.ed.gov (click on policy link) • Contacts • AYP: jon.bridges@state.or.us • Title I requirements: chris.rhines@state.or.us