Download
1 / 48
480 likes | 555 Views
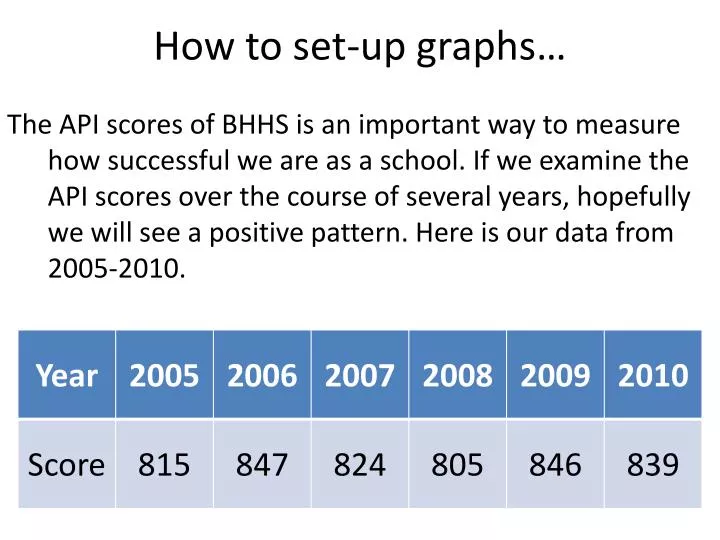
How to set-up graphs…. The API scores of BHHS is an important way to measure how successful we are as a school. If we examine the API scores over the course of several years, hopefully we will see a positive pattern. Here is our data from 2005-2010. Start with a title…be specific. Too vague.

E N D
How to set-up graphs… The API scores of BHHS is an important way to measure how successful we are as a school. If we examine the API scores over the course of several years, hopefully we will see a positive pattern. Here is our data from 2005-2010.
Too vague Lab graph Is this title good? Or too vague?
Too vague Biology Is this title good? Or too vague?
Good title Beverly Hills API Scores Is this title good? Or too vague?
Next…add labels to your graph. Beverly Hills API Scores
Beverly Hills API Scores Time units are usually placed on the X axis
Beverly Hills API Scores Is this label good? Or too vague? Too vague Time
Beverly Hills API Scores Is this label good? Or too vague? Good Time (Years)
Beverly Hills API Scores Don’t forget the Y axis. Be specific. What should the label be? Test score Time (Years)
Beverly Hills API Scores Rule Space out the numbers equally Test score Time (Years)
Beverly Hills API Scores Test score Good or bad spacing? 2005 2006 2007 2008 2009 2010 Bad Time (Years)
Beverly Hills API Scores Test score Good or bad spacing? 2005 2006 2007 2008 2009 2010 Bad Time (Years)
Beverly Hills API Scores Test score Good or bad spacing? Bad Time (Years)
Beverly Hills API Scores Test score Good or bad spacing? Good Time (Years)
Beverly Hills API Scores Good or bad spacing? Test score Bad Time (Years)
Beverly Hills API Scores Good or bad spacing? Test score Bad Time (Years)
Beverly Hills API Scores Good or bad spacing? Test score Good Time (Years)
Beverly Hills API Scores How to choose a bar or line graph? General Rule: If you are showing changes over a period of time, you will make a line graph. General rule: If you are comparing more than one set of information, you will make a bar graph. So what should we make here? Test score Time (Years)
Beverly Hills API Scores Line Graph is best in this situation because we will track the school data over the time length of 2005-2010 Test score Time (Years)
Beverly Hills API Scores Add a dot where the year and score meet Test score Time (Years)
Beverly Hills API Scores Test score Time (Years)
Beverly Hills API Scores Test score Time (Years)
Beverly Hills API Scores Test score Time (Years)
Beverly Hills API Scores Test score Time (Years)
Beverly Hills API Scores Test score Time (Years)
Beverly Hills API Scores Test score Time (Years)
Beverly Hills API Scores The data shows the BHHS API scores have risen and fallen over the past years. Test score Connect the dots Time (Years)
These are the API scores of 6 SoCal high schools for the year 2010. Will this be a bar or line graph? Bar Graph
API Test Scores for 2010 What is a good title for this data? Be specific.
API Test Scores for 2010 What is a good label for the X axis? Schools
API Test Scores for 2010 What is a good label for the Y axis? API test score Schools
API Test Scores for 2010 Now lets number the Y axis API test score Schools
API Test Scores for 2010 API test score Schools
API Test Scores for 2010 Time to add the bars API test score Schools
API Test Scores for 2010 Rule: Bar widths and spacing should be equal. API test score Schools
API Test Scores for 2010 API test score Schools
API Test Scores for 2010 API test score Schools
API Test Scores for 2010 API test score Schools
API Test Scores for 2010 API test score Schools
API Test Scores for 2010 API test score Schools
API Test Scores for 2010 API test score Schools
API Test Scores for 2010 What’s missing? API test score LABELS BHHS SMHS PCH CCHS MCHS VHS Schools
API Test Scores for 2010 What’s wrong with this graph? API test score BHHS SMHS PCH CCHS MCHS VHS Schools
API Test Scores for 2010 What’s wrong with this graph? API test score BHHS SMHS PCH CCHS MCHS VHS Schools
API Test Scores for 2010 What’s wrong with this graph? API test score BHHS SMHS PCH CCHS MCHS VHS Schools
API Test Scores for 2010 What’s wrong with this graph? API test score BHHS SMHS PCH CCHS MCHS VHS Schools