Download
1 / 22
230 likes | 425 Views
Measures of Conserved Synteny. Work was funded by the National Science Foundation’s Interdisciplinary Grants in the Mathematical Sciences All work is joint with John Postlethwait. THE QUESTION. As posed by John Postlethwait :

E N D
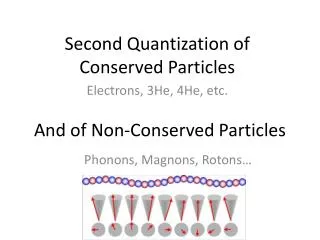
Measures of Conserved Synteny Work was funded by the National Science Foundation’s Interdisciplinary Grants in the Mathematical Sciences All work is joint with John Postlethwait
THE QUESTION As posed by John Postlethwait: When we look at maps of conserved synteny between two species, we see that the orthologous genes are not randomly scattered between the pairs of chromosomes. Some chromosome pairs contain many orthologs and some contain none. If we have mapped some (n) of the orthologs between two species and observe kconserved syntenies, can we estimate the number of conserved syntenies, l, that will exist after we have mapped all the orthologs shared by both species?
DEFINITION • Orthologs – genes that have evolved directly from the most recent common ancestor’s gene From the NCBI WEBSite
DEFINITION • Synteny– the occurrence of two or more genes on the same chromosome within one species Uracil and Tryptophan requiring genes are syntenic on yeast Chromosome XI From the Saccharomyces Genome Database
DEFINITION • Conserved Synteny – a chromosome pair, one from each of two species, that share at least one ortholog Mouse chromosome 7 shares genes with human chromosomes 10, 11, 15, 16, 19 but not with human chromosomes 1 and 2 (it appears). Thus, there is conserved synteny between mouse chromosome 7 and human chromosome 10, for instance. from Jackson Laboratory
FREQUENTIST MODEL Notation: • Let m = rxc be the total number of cells in the Oxford Grid • Label the cells 1, 2, …., m • Let the probability an ortholog fall into cell i be pi • Let k be the number of cells observed to contain orthologs • Let l be the number of cells that will eventually contain orthologs when the entire genomes of the two species are mapped and analyzed • Let n be the number of orthologs mapped
The denominator is the number of ways to choose the l chromosome pairs (cells) to contain the conserved syntenies times the number of ways to distribute n orthologs among those cells • The numerator is the number of ways to choose the (l-k) unseen conserved syntenies from the (m-k) possibilities • The maximum likelihood estimator for l depends on m (the number of possible conserved syntenies) only through the constraint that l is no more than m
BAYESIAN MODEL If we assume a uniform prior distribution on l, then the posterior distribution on l is proportional to the likelihood function of l given the data. The proportionality constant is given by: And a 95% credibility interval runs from the number of observed syntenies, k, to L where L is determined by:
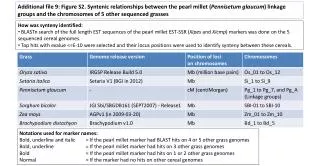
RESULTS Entries of the form [observed number of conserved syntenies, maximum likelihood estimate, 95% upper bound], (number of mapped orthologs). Data from the Mouse Genome Database at Jackson Laboratory (July 28, 2001), BovBase at the Roslin Institute and LocusLink from NIH (June, 2001), and the Murphy et al. 2000 article.
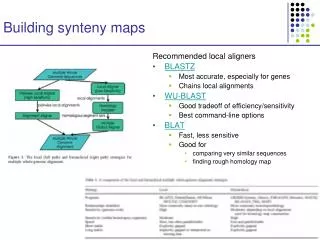
ASSUMPTIONS/PROBLEMS • Orthologs found and mapped are a random sample of all orthologs between two species • Raw number of conserved syntenies do not offer a good comparison of genomic distances between pairs of species due to variation in chromosome numbers
SYNTENIC CORRELATION Notation: • Let (i, j) denote chromosome i in species A and chromosome j in species B • Let ni, j be the number of orthologs mapped to (i, j) • Let n*, j be the number of orthologs mapped to chromosome j in species B and anywhere in species A • Let ni,* be the number of orthologs mapped to chromosome i in species A and anywhere in species B • Let ei,j = (n*, jni,*)/n be the expected number of orthologs
PROPERTIES • Syntenic correlation always exists if 02/0 is interpreted as 0 • Proposed by Cramer, 1946 • ralways lies between 0 and 1 • r is 0 if and only if the orthologs are perfectly independently scattered • r is 1 if and only if, for one of the two species, knowing which chromosome an ortholog belongs to in that species determines which chromosome the ortholog belongs to in the other species
RESULTS Entries above the diagonal are the syntenic correlations with 95% confidence intervals obtained through resampling procedures. Note that the syntenic correlation for humans and cats is not statistically different than that for mice and rats even though the times since divergence are approximately 92 my vs. 40.7 my (Kumar and Hedges, 1999).
QUOTE from Sir Ronald Fisher: …the value of c2 indicates the fact, but does not measure the degree of association. … To measure the degree of association it is necessary to have some hypothesis as to the nature of the departure from independence to be measured.
SYNTENIC ASSOCIATION Notation: • Let mA (mB) be the maximum number of orthologs mapped to any chromosome in species A (B) • Let m*, j (mi, *) be the maximum number of orthologs mapped from species B (A) chromosome j (i) to any chromosome in species A (B) • Let n be the total number of orthologs mapped between species A and B
PROPERTIES • Measures the proportion of errors made in assigning a gene to a chromosome in one species that can be eliminated by knowing which chromosome the gene belongs to in the other • Proposed by Guttman (1941) and Goodman and Kruskal (1954) • Makes sense when there is more than one conserved synteny • lalways lies between 0 and 1 • l is 0 if knowing which chromosome contains a gene in one species is of no help predicting the gene’s chromosome in the other • l is 1 if all the orthologs are concentrated in cells no two of which are in the same row or column
EXAMPLES r = 1 l = 1 Perfect dependence r = 0 l = 0 Perfect independence
EXAMPLES r = 1 l = 9/10 r = 0.0227 l = 0
EXAMPLES r = ½ (only depends on form, not on the entries) l = ¾ (depends on the entries) A 1 A 2 B 1 B 1 Ancestor Guess: A 3 A 3 B 2 B 3