Download
1 / 10

E N D
Evaluation of the Accuracy of in situ Sources of Surface Flux Observations for Model Validation: Buoys and Research Vessels in the Eastern Pacific C. W. Fairall, NOAA Environmental Technology Laboratory, R/ETL6, 325 Broadway, Boulder, CO 80305, USAJ. E. Hare, Cooperative Institute for Research in Environmental Sciences, University of Colorado, Boulder, CO, 80309, USA, Jeff.Hare@noaa.govMeghan Cronin, NOAA Pacific Marine Environmental Laboratory, 7600 Sand Point Way NE, Seattle, WA 98115 USA, Meghan.F.Cronin@noaa.govRobert A. Weller, Woods Hole Oceanographic Institution, Woods Hole, MA 02543 USA, RWeller@whoi.edu ETL, PMEL, and WHOI have cooperated on a program of quality assurance and accuracy assessment of ship-based and buoy-based in situ estimates of sea-air fluxes. The ETL seagoing direct flux system has been used as a ‘transfer’ standard to evaluate observations of bulk-meteorological variables and computed flux estimates from NOAA TAO and WHOI Flux Reference Site buoys. Similar measurements routinely made on NOAA and UNOLS research vessels serving the buoys have also been examined. The ETL measurements were made as part of the PACS/EPIC monitoring program and an OCO quality assurance program for the 95 W and 110 W TAO buoy lines in the tropical eastern Pacific and the WHOI flux reference buoy at 20 S 85 W. Another goal was to acquire a good sample of most of the relevant boundary layer variables that are commonly used in GCM parameterizations of these processes and to provide a more detailed context for measurements made on the buoys over the annual cycle.
Background • Requirement: There is aneed for air-sea flux measurements of high accuracy and high time resolution • Intensive field programs • Satellite retrievals • NWP/Climate model products • Climate monitoring • Relevant quantities: Turbulent fluxes (stress, sensible and latent heat), radiative fluxes (solar and IR), precipitation, bulk meteorology. • Potential: Present technology allows measurements of net heat input to the ocean from ships and buoys to an accuracy of about 10 W/m^2, but this accuracy is not being realized on most platforms • Solution: Implement a multi-faceted program of quality assurance, intercalibration, and data archiving. • Research Vessels (NOAA, UNOLS, Navy, Coast Guard,..) • VOSClim • Strategy: Create a ship flux measurement group • Construct a state-or-the-art portable flux standard that can be installed on any ship to obtain best possible characterization of the relevant variables • Construct a distributed set of sensors to be place with ship sensors for side-by-side intercomparison • Work with each ship operator to improve sensor suite, placement, connection methods, processing, etc • Perform a computational fluid dynamics ICFD) assessment of the flow distortion effects for specific sensor locations • Set up a web site with a Flux Manual detailing procedures and best practices for measurements from ships and flux estimation methods
Cruises • Six cruises to the TAO lines and three cruises to the WHOI site are used in this preliminary study. For the ETL ship-buoy study, all data are first converted to daily averages and then compared when the ship is within 20 km of a selected buoy. All comparisons are treated as a single pool. Biases are examined for core meteorological variables (e.g., sea surface temperature) and derived flux variables (e.g., sensible heat flux). The design target for the total surface heat budget is an accuracy of 10 W/m2, nominally an aggregate of uncorrelated uncertainties of 6 W/m2 in the principal components (sensible+latent, net solar, and net IR fluxes). Grand-average comparisons of buoy-based and R/V-based observations will be presented. Cruises with ETL and Ship System Data PACS Cruises: Intercompare with TAO Buoys Stratus Cruises: Intercompare with WHOI Buoys NOAA Ship Ka’Imimoana 2 PACS cruises NOAA Ronald H. Brown 4 PACS cruises UNOLS Roger Revelle 1 Stratus cruise NOAA Ship Ronald H. Brown 2 Stratus cruises
Closest Thing to a Standard: In Situ MethodsAbsolute In Situ Accuracies • Direct Indirect ~1 day Décor-scale • Precip 10% & 0.1 mm/d Z-R 50% 5 km Pol, q-Conv 25% • Hs+Hl 5% and 3 W/m2 Similar* 100 km • Rsd 2% and 1 W/m2 Poor 20 km • Rld 2.5 W/m2 Fair 50 km *Turbulent fluxes: Accuracy requirements for bulk variables: Δu=0.2 m/s ΔTs=0.2 C ΔTa=0.2 C Δqa=0.2 g/kg (1% tropics, 6% polar)
Sample Sensor Intercomparisonsfor Mean Temperature and Humidity Comparison of simultaneous Assman psychrometer (x’s) and Ron Brown SCS (circles) values against ETL readings from the WHOI Stratus04 cruise: upper panel – air temperature, lower panel – specific humdity. Psychrometer values corrected to 15 m (ETL and ship instrument height).
Selected Platform IntercomparisonsDaily-Averaged Bulk Meteorological Variables
ETL - TAO BUOY Intercomparisons 2000-2003Bulk Variables and Derived Fluxes
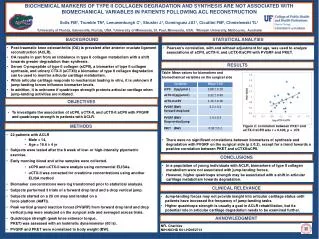
TAO Buoy and RHB-04 Summary Statistics *Still some unresolved differences in ETL – Buoy comparison. Comparing 15 m to 3 m causes problems; some issues with buoy daily averaged data versus raw time series. *Ronald H. Brown in 2004 is well within accuracy requirements for all variables
Conclusions • 1. Comparison of ETL sensors across entire R/V pool suggests no significant bias in ETL data with possible exception of wind speed (could be 0.3 m/s too low) • 2. Basic sensors on Buoys and R/V’s within required accuracy • 3. Some problems with sensor placement (e.g., RHB 1999-2003) • 4. Some problems with early ship-ETL intercomparions (KAI and RHB) indicate poorly performing sensors often not replaced immediately. • Comparison with WHOI buoy in 2001. New sensors look excellent but some offsets with Ta (0.3 C) and qa (0.5 g/kg) with old sensors (see below) • Some unresolved issues with TAO Ta and qa measurements. • Because of 4, better monitoring or redundancy is required for R/V’s to meet climate goals