Download
1 / 1
10 likes | 88 Views
Aggregation, Modeling and Prediction of HIV Antiviral Efficacy Data from the Last 10 Years of Published Clinical Trials (AMPLY)-Part II: Meta-Data Analysis of Full Time Course Response Rates Joannellyn Chiu (1), Xiaohua Gong (1), Mark Lovern (1), Roberto Gomeni (2)

E N D
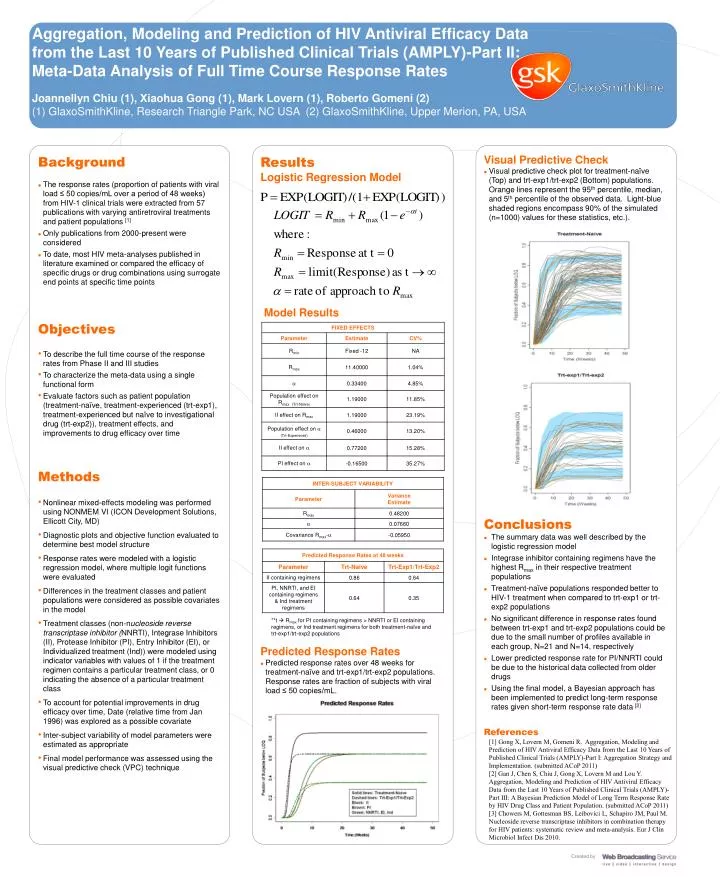
Aggregation, Modeling and Prediction of HIV Antiviral Efficacy Data from the Last 10 Years of Published Clinical Trials (AMPLY)-Part II: Meta-Data Analysis of Full Time Course Response Rates Joannellyn Chiu (1), Xiaohua Gong (1), Mark Lovern (1), Roberto Gomeni (2) (1) GlaxoSmithKline, Research Triangle Park, NC USA (2) GlaxoSmithKline, Upper Merion, PA, USA Visual Predictive Check • Visual predictive check plot for treatment-naïve (Top) and trt-exp1/trt-exp2 (Bottom) populations. Orange lines represent the 95th percentile, median, and 5th percentile of the observed data. Light-blue shaded regions encompass 90% of the simulated (n=1000) values for these statistics, etc.). • Background • The response rates (proportion of patients with viral load ≤ 50 copies/mL over a period of 48 weeks) from HIV-1 clinical trials were extracted from 57 publications with varying antiretroviral treatments and patient populations [1] • Only publications from 2000-present were considered • To date, most HIV meta-analyses published in literature examined or compared the efficacy of specific drugs or drug combinations using surrogate end points at specific time points Objectives • To describe the full time course of the response rates from Phase II and III studies • To characterize the meta-data using a single functional form • Evaluate factors such as patient population (treatment-naïve, treatment-experienced (trt-exp1), treatment-experienced but naïve to investigational drug (trt-exp2)), treatment effects, and improvements to drug efficacy over time • Methods • Nonlinear mixed-effects modeling was performed using NONMEM VI (ICON Development Solutions, Ellicott City, MD) • Diagnostic plots and objective function evaluated to determine best model structure • Response rates were modeled with a logistic regression model, where multiple logit functions were evaluated • Differences in the treatment classes and patient populations were considered as possible covariates in the model • Treatment classes (non-nucleoside reverse transcriptase inhibitor (NNRTI), Integrase Inhibitors (II), Protease Inhibitor (PI), Entry Inhibitor (EI), or Individualized treatment (Ind)) were modeled using indicator variables with values of 1 if the treatment regimen contains a particular treatment class, or 0 indicating the absence of a particular treatment class • To account for potential improvements in drug efficacy over time, Date (relative time from Jan 1996) was explored as a possible covariate • Inter-subject variability of model parameters were estimated as appropriate • Final model performance was assessed using the visual predictive check (VPC) technique Results Logistic Regression Model Model Results Conclusions • The summary data was well described by the logistic regression model • Integrase inhibitor containing regimens have the highest Rmax in their respective treatment populations • Treatment-naïve populations responded better to HIV-1 treatment when compared to trt-exp1 or trt-exp2 populations • No significant difference in response rates found between trt-exp1 and trt-exp2 populations could be due to the small number of profiles available in each group, N=21 and N=14, respectively • Lower predicted response rate for PI/NNRTI could be due to the historical data collected from older drugs • Using the final model, a Bayesian approach has been implemented to predict long-term response rates given short-term response rate data [2] • References **t Rmax for PI containing regimens > NNRTI or EI containing regimens, or Ind treatment regimens for both treatment-naïve and trt-exp1/trt-exp2 populations • Predicted Response Rates • Predicted response rates over 48 weeks for treatment-naïve and trt-exp1/trt-exp2 populations. Response rates are fraction of subjects with viral load ≤ 50 copies/mL. [1]Gong X, Lovern M, Gomeni R. Aggregation, Modeling and Prediction of HIV Antiviral Efficacy Data from the Last 10 Years of Published Clinical Trials (AMPLY)-Part I: Aggregation Strategy and Implementation. (submitted ACoP 2011) [2] Gan J, Chen S, Chiu J, Gong X, Lovern M and Lou Y. Aggregation, Modeling and Prediction of HIV Antiviral Efficacy Data from the Last 10 Years of Published Clinical Trials (AMPLY)-Part III: A Bayesian Prediction Model of Long Term Response Rate by HIV Drug Class and Patient Population. (submitted ACoP 2011) [3] Chowers M, Gottesman BS, Leibovici L, Schapiro JM, Paul M. Nucleoside reverse transcriptase inhibitors in combination therapy for HIV patients: systematic review and meta-analysis. Eur J ClinMicrobiol Infect Dis 2010.