Download
1 / 9
90 likes | 173 Views
Water Quality In Brisbane River And Moreton Bay: Limiting Factors Of Primary Productivity. A.B. Jones, B.J. Dudley, Marine Botany Practical Class & W.C. Dennison Department of Botany, The University of Queensland, Brisbane, 4072. Background & Objectives.

E N D
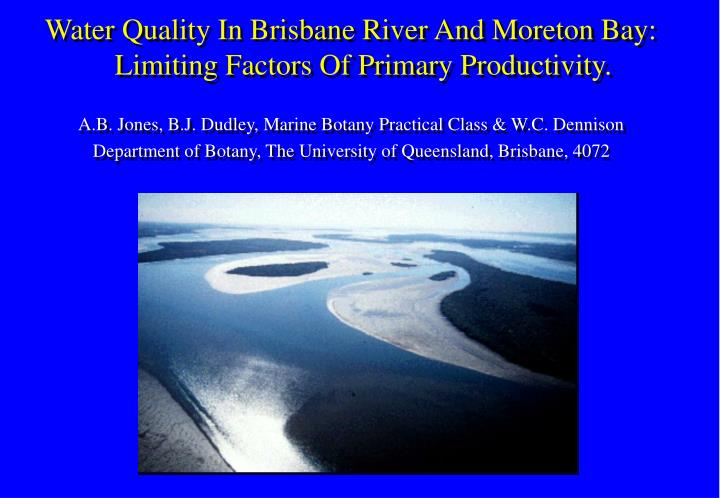
Water Quality In Brisbane River And Moreton Bay: Limiting Factors Of Primary Productivity. A.B. Jones, B.J. Dudley, Marine Botany Practical Class & W.C. Dennison Department of Botany, The University of Queensland, Brisbane, 4072
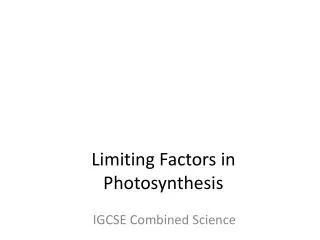
Background & Objectives Increasing eutrophication of coastal marine environments has led to the development of nutrient sampling programs to monitor water quality. Various shortcomings of chemical analyses have identified the need to develop biological indicators (bioindicators) that can be used to detect available nutrient concentrations. We aimed to test the paradigm relating to the factors which limit primary productivity in aquatic systems along a salinity gradient from Lake Wivenhoe (0‰), along the Brisbane River and Moreton Bay (36‰). This paradigm currently states that there is a gradient from phosphorus (P) limitation in freshwater to nitrogen (N) limitation in marine conditions. • Paradigm Freshwater Estuary Marine Seasonal P/Nlimitation Nitrogenlimitation Phosphoruslimitation
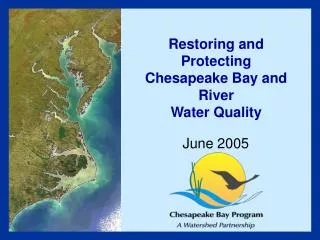
Site Location +8km +33km 33‰ 35‰ -145km 0‰ -82km -12km 0‰ +38km 24‰ 35‰ +32km -36km 35‰ 7.6‰ -72km 0.1‰
TSS B Secchi J NH4+ B NO3- J Water Quality TSS (mg L-1) Secchi depth (m) Nitrogen (µM) Chl a (µg L-1) Site
Methods Phytoplankton bioassays at the 9 sites consisted of 6 treatments; control (no nutrient addition), NO3- (200 µM), NH4+ (30 µM), PO43-(20 µM), SiO3 (60 µM) and a treatment with all nutrients. Water from each site was incubated in 6 L plastic containers at 50% of incident irradiance, with fluorescence (chlorophyll a) of all treatments monitored daily for 7 d.
-82km -145km 0‰ 0‰ B J H F Ñ É Phytoplankton bioassays responses at all nine sites 120 É 2 3 1 -72km J 100 É É É É H 0.1‰ J Ñ H 80 F Ñ H É É J B F 60 É H F J É J É H É Ñ B B B F Ñ É J Ñ F 40 É É B B H J H F É J H Ñ H B H J J H F Ñ B 20 É H É J J J H Ñ H B É J F B H É Ñ H B Ñ É J Ñ H F B H É B H F F F B É H J F Ñ É F J Ñ J H F F B Ñ H B Ñ F Ñ F H B É J H B Ñ F Ñ B Ñ Ñ J B F Ñ F B Ñ Ñ F B B Ñ F B F J J J J 0 Control Ñ 120 -12km 6 5 4 +8km -36km É H Ñ F 100 NO3- Ñ H 24‰ 33‰ 7.6‰ B F B 80 NH4+ Ñ F H É É É 60 Fluorescence É H B É É H PO43- H Ñ Ñ Ñ J 40 F B J F Ñ F H J SiO3 É H Ñ J F F 20 É B B Ñ É B F H É H J Ñ J B F H B Ñ F É Ñ B H J Ñ É J Ñ H É F B J É É B All H F B Ñ É Ñ H F B J J B Ñ J F É H Ñ É J H B F J Ñ H B F J Ñ É J H F B H F F Ñ H É F B É H Ñ F J B J B H É B J 0 120 7 8 9 +32km +33km +38km 100 35‰ 35‰ 35‰ 80 É 60 40 É 20 É J É É J J H H J H É H É É H É J J Ñ H Ñ B B J J Ñ Ñ Ñ F H É H É Ñ É J J Ñ Ñ F H H J É Ñ Ñ H F H J Ñ F É J J É Ñ B É Ñ B B Ñ B H F H J H H F É B Ñ Ñ B F Ñ Ñ Ñ F B B J F Ñ H J H B B É H F J B F B B F F F J B F B J H É H B Ñ J É F É F B B F F B F F 0 0 1 2 3 4 5 6 7 0 1 2 3 4 5 6 7 0 1 2 3 4 5 6 7 Time (days)
Results of the phytoplankton bioassays showing the gradient of nutrient/light limitation Bloom Potential (µg Chl a L-1) Site Light stimulated and nutrient stimulated bloom potential along the Brisbane River and Moreton Bay gradient. For study sites refer to map. Light stimulated bloom potential calculated as the difference between initial and maximum unamended water sample. Nutrient stimulated bloom potential calculated as the difference between nutrient spiked and unamended bloom potential.
Results The phytoplankton bioassays exhibited a gradient in responses; samples from Lake Wivenhoe indicated co-limitation of nutrients, upper Brisbane River phytoplankton responses indicated N limitation and the tidal Brisbane River responses indicated light limitation. The phytoplankton responses from the lower reaches of the river indicated N and Si limitation and in Moreton Bay there was no response to nutrients or light. The lack of response of phytoplankton in the bay demonstrates the inability of the phytoplankton community to respond to nutrients, which is representative of an oligotrophic system. Conclusions Our new paradigm for this system describes co-limitation in freshwater sites, N limitation in the upper reaches of the river, light limitation in the middle reaches, and N and Si limitation in the lower reaches and the bay.
New Model Freshwater Estuary Marine Co-limitationof nutrients Lightlimitation N & Silimitation No phyto-planktonresponse Continued Research These results have demonstrated the need to develop a better understanding of the interactions of light and nutrients as limiting factors for primary productivity in the Brisbane River estuary. Established paradigms for limiting factors do not pertain to this region and need to be tested with field and laboratory studies.