Download
1 / 66
660 likes | 679 Views
Population Distribution and Abundance. Chapter 9 Population Distribution and Abundance. CONCEPT 9.1 Populations are dynamic entities that vary in size over time and space.

E N D
Chapter 9 Population Distribution and Abundance • CONCEPT 9.1 Populations are dynamic entities that vary in size over time and space. • CONCEPT 9.2 The distributions and abundances of organisms are limited by habitat suitability, historical factors, and dispersal. • CONCEPT 9.3 Many species have a patchy distribution of populations across their geographic range.
Chapter 9 Population Distribution and Abundance • CONCEPT 9.4 The dispersion of individuals within a populations depends on the location of essential resources, competition, dispersal, and behavioral interactions. • CONCEPT 9.5 Population abundances and distributions can be estimated with area-based counts, distance methods, mark–recapture studies, and niche models.
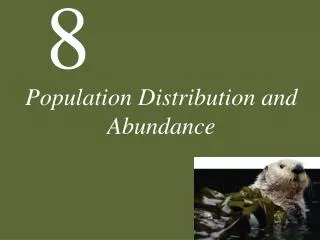
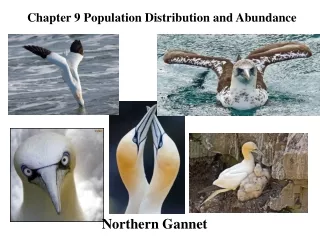
From Kelp Forest to Urchin Barren: A Case Study • Waters around the Aleutian Islands have abundant marine life, including the sea otter and kelp forests.
From Kelp Forest to Urchin Barren: A Case Study Kelp are brown algae that form dense forest-like stands and harbor a diverse community of organisms. Some islands are surrounded by “urchin barrens”—many sea urchins, very little kelp, low species diversity. Grazing of kelp by sea urchins could explain the differences.
From Kelp Forest to Urchin Barren: A Case Study Field studies show a negative correlation between urchin abundance and kelp cover. Experimental studies: Urchins were removed from plots with no kelp. Kelp abundance increased dramatically. But what determines urchin abundance?
Figure 9.2 Do Sea Urchins Limit the Distribution of Kelp Forests?
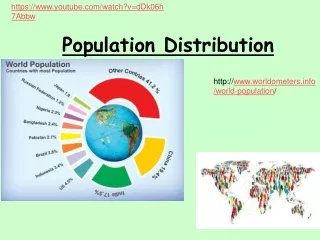
Introduction Distribution: Geographic area where individuals of a species occur. Abundance: Number of individuals in a given area. Ecologists try to understand what factors determine the distribution and abundance of species.
Introduction Populations are dynamic—distribution and abundance can change over time and space. Understanding the factors that influence these dynamics helps us manage populations for harvest or conservation.
CONCEPT 9.1 Populations are dynamic entities that vary in size over time and space.
Concept 9.1Populations Population: Group of interacting individuals of the same species living in a particular area. Interactions include sexual reproduction and competition.
Concept 9.1Populations Abundance can be reported as population size (# of individuals), or density (# of individuals per unit area). Example: On a 20-hectare island there are 2,500 lizards. Population size = 2,500 Population density = 125/hectare
Concept 9.1Populations Sometimes the total area occupied by a population is not known. It is often difficult to know how far organisms or their gametes can travel. When the area isn’t fully known, an area is delimited based on best available knowledge of the species.
Concept 9.1Populations Individuals can be defined as products of a single fertilization: The aspen grove would then be a single genetic individual, or genet. If members of a genet are independent physiologically, each member is called a ramet, e.g. strawberries.
CONCEPT 9.2 The distributions and abundances of organisms are limited by habitat suitability, historical factors, and dispersal.
Concept 9.2Distribution and Abundance Habitat Suitability Abiotic features: Moisture, temperature, pH, sunlight, nutrients, etc. Some species can tolerate broad ranges of physical conditions, others have narrow ranges.
Concept 9.2Distribution and Abundance Creosote bush is very tolerant of dry conditions, as well as cold, and occurs widely in North American deserts. Saguaro cactus can tolerate dry conditions, but not cold temperatures and has a much more limited distribution.
Figure 9.7 The Distributions of Two Drought-Tolerant Plants (Part 1)
Figure 9.7 The Distributions of Two Drought-Tolerant Plants (Part 2)
Concept 9.2Distribution and Abundance Some species distributions depend on disturbance: Events that kill or damage some individuals, creating opportunities for other individuals to grow and reproduce. Example: Some species persist only where there are periodic fires.
Concept 9.2Distribution and Abundance Historical Factors Evolutionary history and geologic events affect modern distribution of species. Example: Polar bears evolved from brown bears in the Arctic. They are not found in Antarctica because of an inability to disperse through tropical regions.
Concept 9.2Distribution and Abundance Dispersal Dispersal limitation can prevent species from reaching areas of suitable habitat. Example: The Hawaiian Islands have only one native mammal, the hoary bat, which was able to fly there.
Concept 9.2Distribution and Abundance Dispersal limitation has also been shown in plant species: When seeds of the annual plant Impatiens capensis were dispersed by hand, the distribution of the plants expanded.
Figure 9.10 Populations Can Expand after Experimental Dispersal
Concept 9.2Distribution and Abundance 27 populations of English bluebells were established experimentally in suitable habitat in 1960. After 45 years, 11 populations persisted, each with many individuals. This suggests that dispersal limitation prevented the bluebells from reaching habitat where they could thrive.
Concept 9.2Distribution and Abundance Dispersal can also affect population density, and vice versa. Many species of aphids produce winged forms (capable of dispersing) in response to crowding. The percentage of offspring that develop wings increases as the density of aphids increases.
CONCEPT 9.3 Many species have a patchy distribution of populations across their geographic range.
Concept 9.3Geographic Range Geographic range—the entire geographic region over which a species is found.
Concept 9.3Geographic Range There is great variation in species geographic ranges: Devil’s Hole pupfish live in a single small desert pool. Many tropical plants have small ranges. In 1978, 90 new species were discovered, restricted to a single mountain ridge in Ecuador.
Concept 9.3Geographic Range Geographic range includes areas occupied during all life stages. Some species, such as monarch butterflies, migrate long distances between summer and winter habitats. For some species, it is difficult to find all the life stages and the ranges they inhabit.
Concept 9.3Geographic Range Not all habitat within a range is suitable, resulting in patchy distributions. This can operate at different spatial scales. At large scales, climate may dictate locations of populations. At small scales, soils, topography, other species, etc., can determine patchiness.
Concept 9.3Geographic Range Patchiness at different scales is illustrated by the shrub Clematis fremontii. It is restricted to areas of dry, rocky soil with few trees, called barrens or glades. The glades occur on outcrops of limestone on south- or west-facing slopes.
CONCEPT 9.4 The dispersion of individuals within a population depends on the location of essential resources, competition, dispersal, and behavioral interactions.
Concept 9.4Dispersion within Populations Dispersion:Spatial arrangement of individuals within a population: Regular—individuals are evenly spaced Random—individuals scattered randomly Clumped—the most common pattern
Concept 9.4Dispersion within Populations Dispersion patterns often result from the distribution of resources. Random or clumped dispersion can also result from short dispersal distances. Competition appears to result in the regular dispersion of some species.
CONCEPT 9.5 Population abundances and distributions can be estimated with area-based counts, distance methods, mark–recapture studies, and niche modeling.
Concept 9.5Estimating Abundances and Distributions Complete counts of individual organisms in a population are often difficult or impossible. Several methods are used to estimate the actual abundance or absolute populationsize.
Concept 9.5Estimating Abundances and Distributions Relative population size: Number of individuals in one time period or place relative to the number in another. Estimates are based on data presumed to be related to absolute population size. Examples: Number of cougar tracks in a given area, or number of fish caught per unit of effort.
Concept 9.5Estimating Abundances and Distributions Interpretation of relative population size can be tricky. Example: Number of cougar tracks is related to population density, but also activity levels of individuals.
Concept 9.5Estimating Abundances and Distributions Area-based counts: individuals in a given area or volume are counted. Used most often to estimate abundance of immobile organisms.
Concept 9.5Estimating Abundances and Distributions Quadrats: Sampling areas of specific size, such as 1 m2. Individuals are counted in several quadrats; the counts are averaged to estimate population size.
Concept 9.5Estimating Abundances and Distributions Example: 40, 10, 70, 80, and 50 chinch bugs are counted in five 10 cm x 10 cm (0.01 m2) quadrats.
Concept 9.5Estimating Abundances and Distributions Distance methods Distances of individuals from a line or point are converted into estimates of abundance.
Concept 9.5Estimating Abundances and Distributions Line transects: Observer travels along line and counts individuals and their distance from the line.
Ecological Toolkit 9.1, Figure B Counting Trees from a Line Transect
Concept 9.5Estimating Abundances and Distributions Mark–recapture studies: Used for mobile organisms. A subset of individuals is captured and marked or tagged, then released. At a later date, individuals are captured again, and the ratio of marked to unmarked individuals is used to estimate population size.