Download
1 / 63
650 likes | 670 Views
Population Distribution. Population Changes. World Population Growth Through History. Billions. 12. 11. 2100. 10. 9. Modern. Age. Old. 8. Iron. Middle. Bronze. Stone. Age. New Stone Age. Ages. Age. Age. 7. Future. 6. 2000. 5. 4. 1975. 3. 1950. 2. 1900. 1. 1800.

E N D
World Population Growth Through History Billions 12 11 2100 10 9 Modern Age Old 8 Iron Middle Bronze Stone Age New Stone Age Ages Age Age 7 Future 6 2000 5 4 1975 3 1950 2 1900 1 1800 Black Death — The Plague 2000 1+ million 7000 6000 5000 3000 1000 A.D. 4000 A.D. A.D. A.D. A.D. A.D. years B.C. B.C. B.C. B.C. B.C. B.C. B.C. 1 1000 2000 3000 4000 5000 Source: Population Reference Bureau; and United Nations, World Population Projections to 2100 (1998).
World Population Growth, in Billions Number of years to add each billion (year) All of Human History (1800) 130 (1930) 30 (1960) 15 (1975) 12 (1987) 12 (1999) 14 (2013) 14 (2027) 21 (2048) Sources: First and second billion: Population Reference Bureau. Third through ninth billion: United Nations, World Population Prospects: The 2004 Revision (medium scenario), 2005.
Annual Increase in World Population Millions Source: United Nations, World Population Prospects: The 2004 Revision, 2005.
Trends in Population Growth Worldwide Population Increase and Growth Rate, Five-Year Periods Percent increase per year Millions Source: United Nations, World Population Prospects: The 2004 Revision (medium scenario), 2005.
World Population Clock 2005 Source: Population Reference Bureau, 2005 World Population Data Sheet.
Projected Population Change, by Country Percent Population Change, 2005-2050 Source: Population Reference Bureau, 2005 World Population Data Sheet.
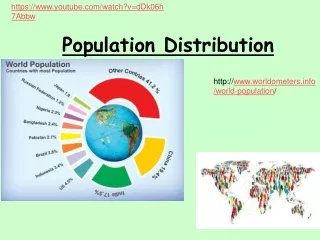
Population Distribution Where are the world’s population clusters?
Distribution of World Population • Population concentrations • The four largest population clusters • East Asia, South Asia, Southeast Asia, Western Europe • Other population clusters • Sparsely populated regions • Dry lands – Cold lands • Wet lands – High lands • Population density • Arithmetic density • Physiological density • Agricultural density
Population concentrations • The four largest population clusters • East Asia, South Asia, Southeast Asia, Western Europe • Other population clusters
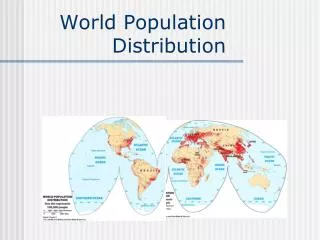
World Population Distribution & Climate Zones Fig. 2-2: World population is unevenly distributed across the earth’s surface. Climate is one factor that affects population density.
Ecumene • The inhabited areas of the world, as opposed to the non-ecumene which is sparsely or not at all inhabited. • The ecumene of a nation is its more densely inhabited core. • These very simplified classifications pose difficulties of delimitation.
Expansion of the Ecumene5000 BC - 1900 AD Fig. 2-3: The ecumene, or the portion of the earth with permanent human settlement, has expanded to cover most of the world’s land area.
China Population Distribution Yangtze and Yellow River Valleys Sichuan Basin CoastalPlains China Proper
South Asia Population Distribution Ganges , Indus and Brahmaputra River Valleys G & B Delta Coastal Plains
Peninsular Southeast Asia Hanoi / Red River Valley Coastal Plains Bangkok / Chao Phraya river Saigon / Mekong Delta
Insular Southeast Asia Manila / Luzon Island Java Island
E D
Industrial Core
Population Density • Population density is the measure of the number per unit area. • It is commonly represented as people per square mile (or square kilometer), which is derived simply by dividing... • Total area population / land area in square miles (or square kilometers)
Population Densities • North America - 32 people per square mile • South America - 73 people per square mile • Europe - 134 people per square mile • Asia - 203 people per square mile • Africa - 65 people per square mile • Australia - 6.4 people per square mile