Download
1 / 59
630 likes | 871 Views
Social support. Kristina Orth-Gomér. Internal medicine Social medicine/Public health Karolinska institutet, Sthlm + Psykosomatisk medicin Charit é Universit ä tsmedizin Berlin. A lonely man is a strong man. Social support - definition.

E N D
Social support Kristina Orth-Gomér
Internal medicineSocial medicine/Public healthKarolinska institutet, Sthlm+Psykosomatisk medicinCharité Universitätsmedizin Berlin
Social support - definition • Social support is the resource provided by other people (S Cohen, L Syme 1985) • Social networks - structure • Social supports - function • Social relations may have negative and positive effects on health
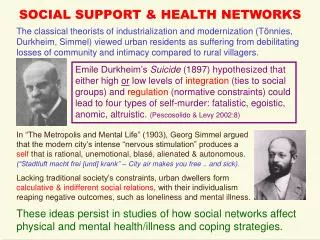
Social networks and health ”the patterns of prospective association between social integration (that is the number and frequency of social relationships and contacts) and mortality are remarkably similar, with some variations by race, sex and geographic locale.” House et al., Science, 1988
Age adjusted relative mortality risk (RR) low vs high social network index men women Alameda county (CA) 2.44* 2.81* Techumseh (MI) 3.87* 1.97 Evans county (GEO) whites 1.83* 1.07 blacks 1.08 1.59 North Karelia (SF) 2.63* 1.92 Gothenburg (S) 4.00* - Swedish survey of 1.50* 1.50* living coditions House et al., Science, 1988
Swedish Survey of Living Conditions • 17 400 men and women, age 15 to 65 • Representative of the Swedish population • Followed for 6 years • Low Social network interaction predicted mortality in men of all ages • Excess risk 50%, controlling for other risk factors
Men, aged 50, born in Göteborg • 741 men, born in 1933 • Followed for 6 years and 15 years • Attachment - close emotional ties • Social integration - help with appraisal and coping, tangible support, belonging
Social inegration (AVSI) • How many people do you know? • How many people do you have regular contact with? • How many friends do you have who can come to visit any time? • How many people can you trust? • How many people can you ask for small favors? • How many people can you turn to in difficulties and expect real help?
Attachment (AVAT) • Is there anyone you can lean on? • Is there anyone who feels very close to you? • Is there anyone you can share happiness with, who would also feel happy ? • Is there anyone you can share most private feelings with ? • Is there anyone to hold and comfort you? • Do people really appreciate what you do for them?
Controlling for life style Protective effects on CVD incidence social integration = .45 P=.014 attachment = . 58 P=.019 Rosengren A Wilhelmsen L Orth-Gomer K, 2003
Conclusions • Socially integrated men have half the risk of getting a myocardial infarction over 15 yrs • Attachment is also protective • Both effects are independent of other risk factors
Attachment did not significantly affect prognosis in women.Are close emotional ties stressful rather than protective in women? Negative effects of social ties?
Aim To evaluate the impact of stress from social relations on prognosis in women CHD patients - controlling for both disease severity, standard risk factors and work stress as measured at baseline.
The Stockholm Marital Stress Scale Is the relationship with your spouse loving? Is the relationship with your spouse friendly? Is the relationship with your spouse routine-like ? Is the relationship with your spouse problematic? Do you engage in leisure activities together with your spouse? Do you have your own private life outside the relationship with your spouse? Is your spouse your closest confidant? Are there things you can’t talk openly about with each other? Have you had serious problems in the relationship with your spouse previously? Have you had serious problems in the relationship with your spouse currently? Have you had serious crises in your relationhip? Have you solved problems actively together? Do you have a sexual relationship with your spouse? Do you find the sexual relationship with your spouse satisfactory? Has your sexual relationship been affected by your heart disease? Has your sexual relationship ceased due to your heart disease?
Depressive symptoms • Lack enthusiasm • Poor appetite • Feel lonely • Feel bored • Troubled sleep • Cry easily • Feel downhearted • Low in energy • Feel hopeless Pearlin, J Health Soc Behav 22:337-356 1981
BUFFER EFFECT STRESSOR DISEASE SOCIAL SUPPORT MAIN EFFECT SOCIAL ISOLATION DISEASE
Progression of atherosclerosis by level of marital stress mean segment diameter change (mm)
Mediating Mechanisms Atherogenic Thrombotic Autonomic imbalance
The metabolic syndrome • Defined according to WHO • Fasting plasma glucose > 7.0 mmol/l • Blood pressure > 160/90 mmHg • Central obesity ( w/h >.85 or BMI>30 kg/m2) • Fasting TG >1.7mmol/l or HDL<1.0 mmol/l
Social support and the Metabolic Syndrome in middle-aged Swedish women Adjusted for age, menopausal status, educational level, smoking, exercise and alcohol consumption
Methods • All female patients, aged 65 or under who wereadmitted with an acute coronary syndrome between 1991 and 1994 in Stockholm (n=292) • Diagnosis at baseline: Acute Myocardial Infarction (n=110) or unstable Angina Pectoris (n=182) • followed for five years for recurrent event • sleep complaints were measured at baseline using a standardized questionnaire • 283 women answered the sleep questionnaire
The Sleep Questionnaire • Have you perceived any of the following • complaints during the last time? • Difficulties falling asleep • Disturbed/restless sleep Sleep quality • Premature awaking index • Heavy snoring • Not feeling refreshed
Recurrent cardiac events and subjective sleep quality Sleep quality n Scores HR (95% CI)* p good 74 0-3 1 average 141 4-6 1.97 (1.01-3.85) .047 poor 68 7-9 2.55 (1.24-5.24) .011 *Hazards ratio, adjusted for age, BMI, symptoms of heart failure, hypertension, diagnosis at index event, diabetes, HDL-cholesterol, triglyderides, smoking, and education
Depressive symptoms • Lack enthusiasm • Poor appetite • Feel lonely • Feel bored • Troubled sleep • Cry easily • Feel downhearted • Low in energy • Feel hopeless Pearlin, J Health Soc Behav 22:337-356 1981
Results Poor sleep quality and not feeling well-rested are associated with poorer prognosis in women with a prior cardiac event.
Are variations in heart rate and rhythm - autonomic imbalance a mediating mechanism?
HEART RATE VARIABILITY Derived from 24-hour Holter recordings: SDNN index Total power Low Frequency power (LF) High Frequency power (HF) Very Low Frequency power (VLF) SDNN index: average of the standard deviations of all normal to normal intervals for each 5-minute interval of the entire recording (ms)
HRV - high (healthy)low (unhealthy) Heart rate variability = ability ofthe heart to react to stressors
Differences in SDNN index (msec) between standard risk factor groups, adjusted for age (controls, N=249). Standard risk factors Mean SEM P Smoking No 42.9 .83 Yes 40.0 1.21 .05 Sedentary lifestyle No 42.7 .77 Yes 39.4 1.48 .05 Obesity (kg/m2) BMI28.6 43.2 .76 BMI>28.6 37.6 1.43 .001 Systolic blood pressure (mmHg) 140 43.0 .72 >140 36.1 1.75 .001