Download
1 / 39
390 likes | 500 Views
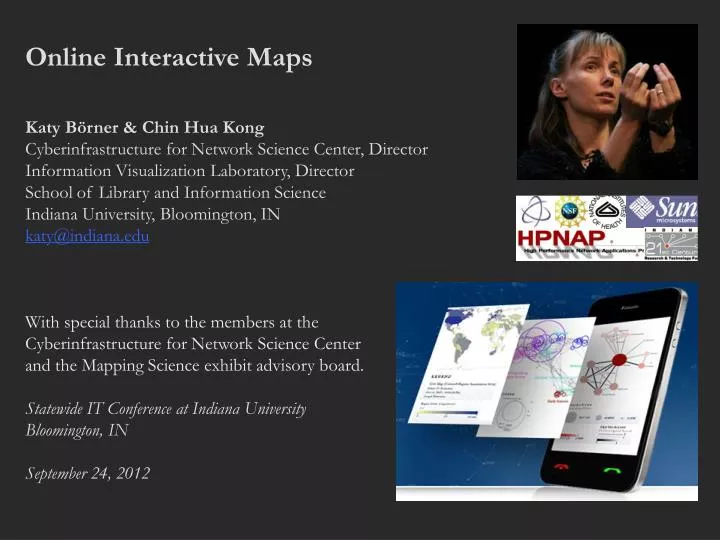
Online Interactive Maps Katy Börner & Chin Hua Kong Cyberinfrastructure for Network Science Center, Director Information Visualization Laboratory, Director School of Library and Information Science Indiana University, Bloomington, IN katy@indiana.edu

E N D
Online Interactive Maps Katy Börner& Chin Hua Kong Cyberinfrastructurefor Network Science Center, Director Information Visualization Laboratory, Director School of Library and Information Science Indiana University, Bloomington, IN katy@indiana.edu With special thanks to the members at the Cyberinfrastructurefor Network Science Center and the Mapping Science exhibit advisory board. Statewide IT Conference at Indiana University Bloomington, IN September 24, 2012
Find your way Black Box Find collaborators, friends Take terra bytes of data Identify trends 2
Google Map JavaScript API was used to implement both maps with two aggregation layers for each. The geographic map aggregates to the state level and the city level. The science map has a high level of aggregation of 13 top-level scientific disciplines and a low level of 554 sub-disciplines. 4
Search result for “corn” Icons have same size but represent different #records 7
Click on one icon to display all records of one type. Here publications in the state of Florida. 8
Detailed information on demand via original source site for exploration and study. 9
Search result for “Miscanthus,” a special energy biomass crops for second generation biofuel. 10
The science map at 13 top-level scientific disciplineslevel. 11
http://nrn.cns.iu.edu Geospatial Analysis (Where) A geospatial map of the US is used to show where what science is performed by whom. 23
Topical Analysis (What) Science map overlays show where a person, department, or university publishes most in the world of science. 24
Related Talks Monday Tuesday 25
Börner, Katy. (March 2011). Plug-and-Play Macroscopes. Communications of the ACM, 54(3), 60-69. Video and paper are at http://www.scivee.tv/node/27704 26
OSGi/CIShell powered tool with NWB plugins and many new scientometrics and visualizations plugins. Börner, Katy, Huang, Weixia (Bonnie), Linnemeier, Micah, Duhon, Russell Jackson, Phillips, Patrick, Ma, Nianli, Zoss, Angela, Guo, Hanning & Price, Mark. (2009). Rete-Netzwerk-Red: Analyzing and Visualizing Scholarly Networks Using the Scholarly Database and the Network Workbench Tool. Proceedings of ISSI 2009: 12th International Conference on Scientometrics and Informetrics, Rio de Janeiro, Brazil, July 14-17 . Vol. 2, pp. 619-630. Sci2 Tool – “Open Code for S&T Assessment”http://sci2.cns.iu.edu GUESS Network Vis Sci Maps Horizontal Time Graphs
Sci2 Tool Geo Maps Circular Hierarchy
Sci2 Tool Usage at National Institutes of Health Sci2 Tool now supports Web services and serves as a visual interface to publically available NIH RePORT Expenditure and Results RePORTER)/ RePORTERdata provided by NIH. 29
Sci2 Tool Usage at National Institutes of Health NETE A|V - Temporal Analysis Find and select one or multiple PIs 30
Sci2 Tool Usage at National Institutes of Health NETE A|V - Temporal Analysis Visualize portfolio of projects on the timescale • Projects with award amounts • Projects by IC funding • Projects by PIs 31
Sci2 Tool Usage at National Institutes of Health NETE A|V - Temporal Analysis – Projects with Award Amounts Four-variable visualizations, e.g. time, amounts, PIs and projects 32
Sci2 Tool Usage at National Institutes of Health NETE A|V – Geospatial Analysis – Projects by External Organization 33
Sci2 Tool Usage at National Institutes of Health NETE A|V – Topical Analysis – Publications in a Project Portfolio 34
Sci2 Tool Usage at National Institutes of Health NETE A|V – Network Analysis – (Co-) PIs to Projects 35
Related Talks Monday Tuesday 36
References Börner, Katy, Chen, Chaomei, and Boyack, Kevin. (2003). Visualizing Knowledge Domains. In Blaise Cronin (Ed.), ARIST, Medford, NJ: Information Today, Volume 37, Chapter 5, pp. 179-255. http://ivl.slis.indiana.edu/km/pub/2003-borner-arist.pdf Shiffrin, Richard M. and Börner, Katy (Eds.) (2004). Mapping Knowledge Domains. Proceedings of the National Academy of Sciences of the United States of America, 101(Suppl_1). http://www.pnas.org/content/vol101/suppl_1/ Börner, Katy, Sanyal, Soma and Vespignani, Alessandro (2007). Network Science. In Blaise Cronin (Ed.), ARIST, Information Today, Inc., Volume 41, Chapter 12, pp. 537-607. http://ivl.slis.indiana.edu/km/pub/2007-borner-arist.pdf Börner, Katy (2010) Atlas of Science. MIT Press. http://scimaps.org/atlas Scharnhorst, Andrea, Börner, Katy, van den Besselaar, Peter (2011) Models of Science Dynamics. Springer Verlag. 37
We are Hiring! Senior Software Engineer/Research Analyst (3IT) IU Job #6839 As Senior Software Engineer, you will perform research and programming for current and future externally funded research projects at the CNS Center. These projects include tools powered by the Cyberinfrastructure Shell (CIShell, http://cishell.org), an open-source software platform that supports the interchange of datasets and algorithms; MapIN, a map of Indiana’s expertise and resources; and other online interactive maps and web sites. You will participate in the entire software development process, from the collection of user stories through planning, implementation, testing, deployment, and documentation. You will also be expected to participate in the training new developers, and the creation of educational material for workshops. As Senior Software Engineer, you will have a chance to help set the standards of our team in many areas, including code, teamwork, product direction, and process. Software Developer (2IT) IU Job #6862 As a Software Developer, you will work in a team of four to perform research and programming for current and future externally funded research projects at the CNS Center. The main focus will be on tools powered by the Cyberinfrastructure Shell (CIShell, http://cishell.org). CIShell is an open-source software platform, built on Java and OSGi that allows developers and scientists to easily exchange datasets and algorithms, and bundle them into custom tools that serve the particular needs of research communities. You will participate in the entire software development process, from the collection of user stories through planning, implementation, testing, deployment, and documentation. 38
All papers, maps, tools, talks, press are linked from http://cns.iu.edu CNS Facebook: http://www.facebook.com/cnscenter Mapping Science Exhibit Facebook: http://www.facebook.com/mappingscience


![Making maps, many maps! [What is GIS?]](https://cdn1.slideserve.com/3592384/making-maps-many-maps-what-is-gis-dt.jpg)