Download
1 / 28
290 likes | 534 Views
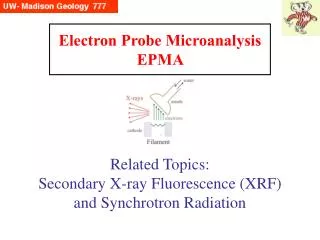
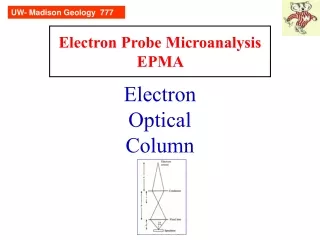
Revised 10-19-2005. UW- Madison Geology 777. Electron Probe Microanalysis EPMA. Wavelength Dispersive Spectrometry (WDS) I. UW- Madison Geology 777. Generic EMP/SEM. Electron gun. Column/ Electron optics. Optical microscope. EDS detector. Scanning coils. SE,BSE detectors.

E N D
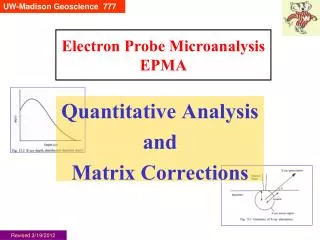
Revised 10-19-2005 UW- Madison Geology 777 Electron Probe MicroanalysisEPMA Wavelength Dispersive Spectrometry (WDS) I
UW- Madison Geology 777 Generic EMP/SEM Electron gun Column/ Electron optics Optical microscope EDS detector Scanning coils SE,BSE detectors WDS spectrometers Vacuum pumps Faraday current measurement
UW- Madison Geology 777 Key points X-rays are dispersed by crystal with only one wavelength (nl) reflected (=diffracted), with only one wavelength (nl) passed to the detector Detector is a gas-filled (sealed or flow-through) tube where gas is ionized by X-rays, yielding a massive multiplication factor (‘proportional counter’) X-ray focusing assumes geometry known as the Rowland Circle Key features of WDS are high spectral resolution and low detection limits
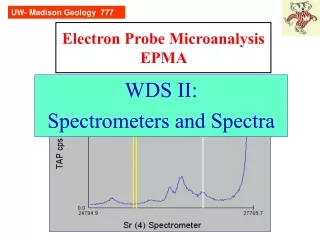
UW- Madison Geology 777 Spectrometers An electron microprobe generally has 3-5 spectrometers, with 1-4 crystals in each. Here, SP4 (spectro #4) of our SX51 (#485) with its cover off. Crystals (2 pairs) Proportional Counting Tube (note tubing for gas) PreAmp
UW- Madison Geology 777 BSE detectors alternate X-ray path Only a small % of X-rays reach the spectrometer. They first must pass thru small holes (~10-15 mmdia; red arrows) in the top of the chamber (above, looking straight up), then thru the column windows (below, SP4).Thus, in our EMP, there are different vacuum regimes in the chamber vs the spectrometer. Crystal
BA’ = A’C = d sinq for constructive reinforcement of a wave, the distance BA’ must be one half the wavelength. Thus, 2d sinq = l and by similar geometric construction = nl UW- Madison Geology 777 Wavelength Dispersion Of the small % of X-rays that reach the crystal, only those that satisfy Braggs Law will be diffracted out of the crystal. nl = 2d sinq Note that exact fractions of l will satisfy the conditions for defraction. Thus, there is a possibility of “higher order” (n=2,3,...11,?) interference in WDS (but there also is the means electronically to discriminate against the interference).
BA’ = A’C = d sinq for constructive reinforcement of a wave, the distance BA’ must be one half the wavelength. Thus, 2d sinq = l and by similar geometric construction = nl UW- Madison Geology 777 nl = 2d sinq What is nl ? This is sometimes difficult to comprehend. Assume you have your spectrometer set to one particular position, which means for that sinq and that 2d (let’s say they = 12 Å), there are several possible signals that the spectrometer can tune in to at that position: (1) an x-ray with wavelength of 12 Å, (2) an x-ray of 6 Å, (3) an x-ray of 4 Å, (4) an x-ray of 3 Å, etc --of course, if and only if such x-rays are being generated in the sample.
UW- Madison Geology 777 Lots of Crystals Over the course of the first 30 years of EPMA, ~50 crystals and pseudocrystals have been used.
UW- Madison Geology 777 Crystals and PC/LSMs • Consider the order of 2d in Braggs Law: sin q varies from .2-.8, and l varies over a wide range from hundreds to fractions of an A. Thus, we need diffractors that cover a similiar range of 2d, from around 1 Å to hundreds of Å. In our SX51, we utilize TAP, PET and LIF crystals for the shorter wavelengths. For longer wavelengths, there are 2 options: • pseudocrystals (PCs), produced by repeated dipping of a substrate in water upon which a monolayer (~soap film) floats,progressively adding layer upon layer, or • layered synthetic microstructures (LSMs; also LDEs, layered diffracting elements), produced by sputtering of alternating light and heavy elements, such as W and Si, or Ni and C. • Both these are periodic structures that diffract X-rays. The LSMs yield much higher count rates; however, peaks are much broader, which have good/bad consequences, discussed later. • In reality, people interchange the words PC, LSM, LDE, etc. Cameca uses PC and JEOL uses LDE, for same things.
UW- Madison Geology 777 Crystals and PCs on the UW SX51 There is a more precise form of Braggs Law, that takes into account refraction, which is more pronounced in the layered synthetic diffractors, nl = 2d sinq(1-k/n2) k is refraction factor, n is order of diffraction
Pseudocrystals/LSMs Goldstein et al, p. 280
UW- Madison Geology 777 Crystals and PCs: Which to use? • The EPMA user may have some control over which crystal to use; some element lines can be detected by either of 2 crystals (e.g. Si Ka by PET or TAP, V Ka by PET or LIF), whereas other elements can only be detected by one (e.g. S Ka by PET). Each probe has its own (unique?) set of crystals and the user has to work out the optimal configuration, taking into account concerns such as • time and money • interferences vs counting statistics (sharper peaks usually have lower count rates) • stability (thermal coefficient of expansion)
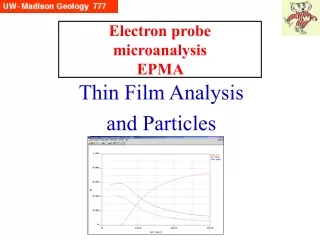
The class project in 2002 was to collect data that will be put in a chart to compare the efficiency of different crystals/ PCs for certain elements. Crystal comparison Å Å TAP gives a higher count rate, and wider peak for Si Ka vs. using PET Si Ka on TAP sin q = 27714 P/B= 4862/40=122 FWHM=0.038Å Si Ka on PET sin q = 81504 P/B= 207/1.3=159 FWHM=0.006Å
UW- Madison Geology 777 Max 4862 cts Peak (spectral) resolution is described by FWHM Full Width Half Max Full Width Half max 2431 cts counts Si Ka on TAP sin q = 27714 P/B= 4862/40=122 FWHM=0.038Å Å
UW- Madison Geology 777 P10 gas (90% Ar - 10% CH4) is commonly used as an ionization medium. The X-ray enters through the thin window and 3 things can occur: (1) the X-ray may pass thru the gas unabsorbed (esp for high keV X-rays); (2) it may produce a trail of ion pairs (Ar+ + e), with number of pairs proportional to the X-ray energy; and (3) if the X-ray is >3206 eV it can knock out an Ar K electron, with L shell electron falling in its place. There are also 3 possibilities that can result from this new photon: WDS detector (3a) internal conversion of the excess energy with emission of Auger electron (which can produce Ar+ + e pairs); (3b) Ar Ka X-ray itself can knock out electron of another Ar molecule, producing Ar+ + e pair; or (3c) the Ar Ka X-ray can escape out thru a window, reducing the number of Ar+ + e pairs by that amount of energy (2958 eV)
UW- Madison Geology 777 Nominally, it takes 16 eV to produce one Ar+- electron pair, but the real (effective) value is 28 eV. For Mn Ka (2895 eV), 210 ion pairs are initially created per X-ray. However, there is a multiplier effect (Townsend avalanching). For our example of Mn Ka, all 210 electrons are accelerated toward the center anode (which has a positive voltage [bias] of1200-2000v) and produces many secondary ionizations. This yields a very large amplification factor (~105), and has a large dynamic range (0-50,000 counts/sec). Detector amplification
UW- Madison Geology 777 Detector windows Thin (polypropylene) windows are used for light X-rays (e.g. those detected by TAP and PC crystals). Since the windows are thin, the gas pressure must be low (~0.1 atm). And being thin windows, some of the gas molecules can diffuse out through them -- so the gas is replenished by having a constant flow. For thicker windows (mylar), 1 atm gas pressure is used (with higher counts resulting). Sealed detectors with higher pressure gas (e.g. Xe) are also used by some.
UW- Madison Geology 777 WDS detector The bias on the anode in the gas proportional counter tube needs to be adjusted to be in the proportional range. Too high bias can produce a Geiger counter effect. Too low produces no amplification.
UW- Madison Geology 777 WDS pulse processing The small electron pulses (charges) generated in the tube are first amplified in the pre-amp (top) located just outside the vacuum on the outside of the spectrometer, then sent to the PHA board where they are amplified (center) and shaped (bottom). Each figure is for one (the same) pulse. Goldstein et al Fig. 5.10
UW- Madison Geology 777 Ar-escape peak There is a probability that a small number of Ar Ka X-rays produced by the incident X-ray (here, Fe Ka) will escape out of the counting tube. If this happens, then those affected Fe Ka X-rays will have pulses deficient by 2958 eV. Fig 7.8 is an unusual plot of this (for teaching purposes); what is normally seen is the Pulse Height distribution where the pulses are plotted on an X-axis of a maximum of 5 or 10 volts. Reed, 1993, p. 90
UW- Madison Geology 777 Actual PHA plot for Fe Ka: note the Ar-escape peak
UW- Madison Geology 777 Actual PHA plot for Si Ka: there is no Ar-escape peak. WHY?
UW- Madison Geology 777 Higher order reflections Recall nl = 2d sinq. Higher order reflections are possible in your specimens, and must be avoided to prevent errors in your analyses. Reed (1993) reports that LIF can show a strong second order peak, up to 10% of the first order peak. In 1999, the 777 class examined the higher order reflections of Cr Ka lines. On PET, 2nd and 3rd order peaks were present, and decreased ~an order of magnitude with increasing n. On LIF, up to the 8th order peak was present. Here, the intensity of the odd numbered orders was less than the following even order, e.g. the 5th order Ka had 30% fewer counts than the 6th order line. Differential mode of pulse height analysis (PHA) may be used to ignore counting higher order X-rays.
window baseline UW- Madison Geology 777 Pulse Height Analysis If a higher order reflection falls upon a peak (or unavoidable background) position, the analyst has the option of using Pulse Height Analysis, i.e. setting up a window and not counting any X-rays that have energies greater than the window’s upper limit. There is a lower limit (baseline, usually 0.5 volts). The window stretches above it (here 4 volts), and thus a second order reflection should have a pulse height around 6 volts, and would not be counted. There are some situations where operation in differential mode can introduce errors (pulse height depression), so the normal mode is integral. And if differential is used, it is good to do some tests first to get a feeling of how comprehensive its filtering action is.
UW- Madison Geology 777 Integral vs Differential PHA Analysis of ‘light elements’ such as C is complicated because of the long wavelength (44 Å) which means that higher order reflections of many elements can interfere. At top, where the PHA is set to the “count everything” integral mode, the 3rd order reflection of Ni La1 falls very close to C Ka and adds some to C peak counts. Note also the 2 and 3 order Fe L lines. By setting the detector electronics to the discrimination mode (“differential”), bottom, the higher order lines are strongly (but not totally) suppressed. Spectrometer scans Goldstein et al, p.507-8
UW- Madison Geology 777 Putting it all together: Spectrometer = Crystal + Detector moving in a highly choreographed danceDance floor =Rowland Circle
C B A UW- Madison Geology 777 Rowland Circle For most efficient detection of X-rays, 3 points must lie upon the focusing circle known as the Rowland Circle. These points are the beam impact point on the sample (A), the active central region of the crystal (B), and the detector -- gas-flow proportional counter (C).
UW- Madison Geology 777 The loci of 3 points must always lie on the Rowland Circle. Starting at the top position (blue), there is a shallow angle of the X-ray beam with the analyzing crystal. To be able to defract a longer wavelength X-ray on the same spectrometer, the crystal travels a distance further out, and effectively the (green) Rowland Circle “rolls”, pinned by the beam-specimen interaction point. Rowland Circle