Download
1 / 9
90 likes | 100 Views
Electron probe microanalysis EPMA. Thin Film Analysis and Particles. What’s the point?. EPMA is traditionally done for bulk material. What are the issues for thin films? How precise/accurate are such analyses? Can unpolished particles be analyzed by WDS or EDS?. Bulk vs thin film.

E N D
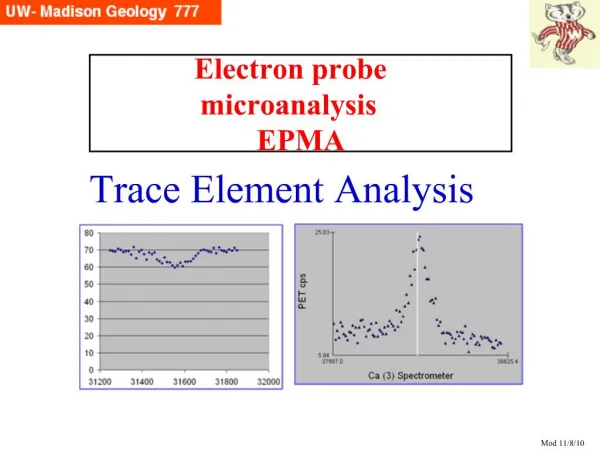
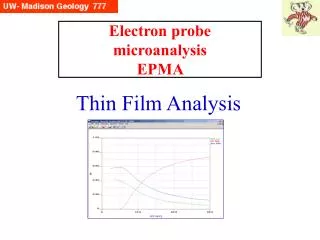
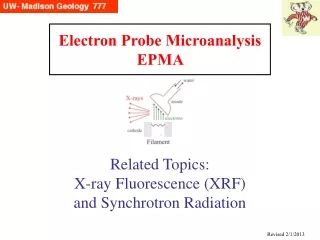
Electron probe microanalysisEPMA Thin Film Analysis and Particles
What’s the point? EPMA is traditionally done for bulk material. What are the issues for thin films? How precise/accurate are such analyses? Can unpolished particles be analyzed by WDS or EDS?
Bulk vs thin film Normal EPMA assumes that the electron beam is exciting a homogeneous volume, i.e. there is no difference either laterally or vertically. Thus, the matrix correction is being applied in a uniform matter, and there is one applicable f(rz) profile for each element . As research has improved the accuracy of the f(rz) profiles, it is now possible to take thin films (including multiple films) and apply f(rz) models and calculate best fits for unknown parameters. For example, if you know that there is a TiO2 skin atop your Ti metal, you can acquire Ti and O X-ray counts at several E0 values, and then try to match them by modeling various film thicknesses with 3rd party software programs. Or if you have been able to measure a film thickness, you could determine what the phase stoichometry is.
It can be helpful to run Monte Carlo simulations of thin films. Here, the new Casino software is used to model 15 keV electrons hitting a 1 mm layer of TiO2 on Ti. Red trajectories to top left are BSEs. At bottom left is a model of the O Ka f(rz) profile (blue), plus the profile of X-rays predicted to escape (red) and get to the detector. MC Simulation: TiO2 on Ti Here the range of various energy incident electrons are modeled.
Thin Film Software Thin films can be studied with the electron microprobe, although the acquired data cannot be run through the normal probe software (which only works for homogeneous volumes). Standard counts are acquired on normal standards, and then K-ratios acquired from the thin films at several E0 values (minimally 3, preferably more; e.g. 5, 10, 15 keV). There are two software packages: the costly STRATAGem, above left (~$6K) and the freeware GMRFilm (below: written by R.Waldo of GM ). STRATA-Gem is very slick and has a Windows interface, whereas GMRFilm runs under DOS and requires manual tabulating. In the bottom example, we see that a 0.1 mm oxide coat on Ti ‘robs’ the metal of ~6% of the Ti Ka counts it should yield.
Oxygen on Boron metal (2 standards) This and the next slide demonstrate the utility of thin film software. We needed to verify that our boron standard was pure, but there was a small peak at O ka. I ran it at 2, 3, 7 & 15 keV (red and black symbols), and then tested various interpretations of the data. Oxygen as bulk did not fit, whereas a 12Å oxide film did. Experiment Models Not bulk, but ~12 Å film B2O3 (2 different Boron standards) Thin film modeled with GMRfilm
Carbon on Boron metal Not bulk, but ~12-18 Å C film (2 different Boron standards) Thin film modeled with GMRfilm
Particles - 1 Mass effect/error: electrons escape from sides of small particles if E0 is large enough (left) Absorption effect of non-flat upper surface: different path length from normal flat geometry (middle) Variable effect of geometry of trajectory between beam impact area on non-uniform surface and the location of the detector (right) Goldstein et al, 1992, p. 479, 481
Particles - 2 • Traditional approach: normalize numbers – but this is not very good (above left table) • Armstrong and Buseck (1975) developed a procedure based upon a regular geometric shape factor, where the different path length and other effects could be used. Method is based on bracketing particle and beam overscanning during collection of spectrum by EDS and modeling of electron path and x-ray propagation out through several shapes – sphere, hemisphere, squared pyramid, and rectangular, tetragonal, cylindrical and right triangular prisms. Correction factors are given in terms of predicted k-factors for pairs of particular elements, vs particle thickness along e beam. This is not easy, takes much trial and error, but apparently can yield fairly good results (see table above). Goldstein et al, 1992, p. 488, 489