Download
1 / 22
220 likes | 315 Views
Nutrients and Pollution in Neponset Estuary (but not really) . Kenly. Outline. Introduction Nutrients/gas Bacteria PCBs Metal What do we know? Nutrients/gas Bacteria PCBs Metal What do we need to find out? Nutrients/gas Bacteria PCBs Metal. Why are Nutrients Important?.

E N D
Nutrients and Pollution in Neponset Estuary (but not really) Kenly
Outline Introduction • Nutrients/gas • Bacteria • PCBs • Metal What do we know? • Nutrients/gas • Bacteria • PCBs • Metal What do we need to find out? • Nutrients/gas • Bacteria • PCBs • Metal
Why are Nutrients Important? • Nutrients like N and P limit primary production in aquatic systems. In estuaries, N is usually the limiting nutrient (Herbert, 1999). • Adding more of this limiting nutrient increases primary production, so understanding the amount of nutrient-loading that’s taking place in Neponset is key to understanding the health of the system.
Why is adding N so bad? • Throws off balance between production, recycling, and fixation. • Blooms, followed by anoxia (eutrophication, Vitousek et al, 1997). • Bye bye, eelgrass.
Why do we care about nutrients in Neponset? • Affects water quality. Amount of nutrient loading taking place has big impacts on dissolved oxygen concentrations and primary production. • Primary production in turn has effects on trophic structure in the rest of the estuary. Phytoplankton diversity drops, eelgrass and scallops disappear, and so on (Cosper et al, 1987). • “decrease in species diversity [of eelgrass] along the eutrophication gradient and over time “ - Cardoso et al, 2003
Bacteria! • Bacteria from leaky septic or sewer systems can leach into estuaries. These pathogens lead to an increase in waterborne gastroenteritis and therefore have hazardous effects on human health (EPA 2008). • bacteria can be harmful to the environment because waste expelled into an estuary is broken down by microbes, which then deplete the oxygen in the system just like the decomposition of dead phytoplankton that was discussed earlier (EPA 2008).
Pollution…it ain’t no joke • Polychlorinated biphenyls come from disposal of waste from machining, painting, electronics, etc (Brealt, 2011). • Known to disrupt many systems in the body including immune and endocine (EPA.gov).
Heavy metals…they’re pretty cool : O • Mercury deposition has increased worldwide (Fry and Chumchal, 2012), and this can lead to a buildup of Hg in sediments. • Depending on microbial community composition, this mercury can be methylated by sulfate reducing bacteria to methylmercury (Auer et al. 2009). This form is much more toxic (Hammerschmidt and Fitzgerald, 2004). • Cadmium and lead are also hazardous to human health. Cadmium emissions from batteries can leach into estuaries and can cause kidney damage if ingested (Jarup, 2003). Lead is related mainly to road transport (it used to be in gasoline) and is widespread over many types of ecosystems (Jarrup, 2003). These three metals are the most toxic and can all be harmful on human health when eaten (Jarup, 2003). • Mercury and cadmium are particularly toxic to eelgrass.
Outline Introduction • Nutrients/gas • Bacteria • PCBs • Metal What do we know? • Nutrients/gas • Bacteria • PCBs • Metal What do we need to find out? • Nutrients/gas • Bacteria • PCBs • Metal
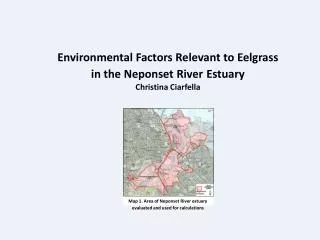
So what’s the status? • No idea. The vast, vast majority of the focus is on the river…there is only one sampling site in the estuary itself and I couldn’t even find the data for that. So…what do we know about nutrients and pollution in the river?
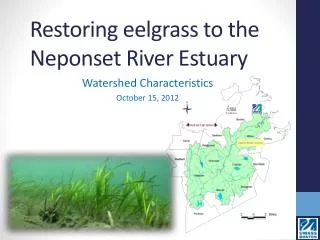
Nutrients • There are many sources of excess nutrients in the Neponset watershed. Fertilizer, animal waste, runoff from impervious surfaces, direct input of grass clippings from lawns and golf courses, leaky sewers, bad septic systems, and dams all contribute excess nutrients to the system (Neponset.org). • ammonia concentrations are below the chronic water quality criteria for ammonia. Concentrations ranged from 0-0.295 mg/L, which is normal. • The MWRA found that nitrate and nitrite (reported combined) in the river mouth ranges from 1-12 uM mostly, with some spikes reaching up to 30uM. Concentrations in the river itself were much higher, ranging from 20-60 uM in some sites • 39% of sampling sites exceeding accepted nitrogen concentrations (Neponset.org). • Phosphorus levels never exceeded 2uM, according to the MWRA website, which is fine in terms of the estuary because P is not the limiting nutrient there. • Neponset isn’t dammed; there is good flushing and lots of marsh to filter pollution. Might not be so terrible (MWRA website).
DO • Near Foxboro/Canton the lowest DO is 6.6mg/L, and at Mother Brook only 15 of 397 samples taken had DO concentrations lower than 5mg/L (Boston Harbor Watershed, 1999). • The section with the lowest DO was closest to the estuary, in the Milton to Dorchester Bay region. It went as low as 0.5mg/L at some sampling sites, but it was highly variable, with some sites showing percent saturations of over 124% (Boston Harbor Watershed, 1999).
Bacteria • Reductions in bacteria loads from 72-99% are called for to even meet total maximum daily loads. • These stations that don’t meet water quality standards have 200 or more organisms per 100ml sample, or more than 10% of samples from a station have counts exceeding 400 organisms/100ml. • the areas of the estuary that are more developed have higher bacteria levels. This is usually due to leaking or illicit sewer connections. These issues become worse in wet weather as storm runoff flushes materials from pipe drainage systems.
Metals and PCBs • Some segments of the Neponset River show contamination of heavy metals from wastewater discharge from companies that dump waste into the river (Boston Water Quality Report, 1999). • Hg, Cd, Ni, Cu, Cr, and Pd are all elevated . • Concentrations of PCBs have been found to be as high as 26,000 mg/kg of sediment and 0.05-12 ug/L in groundwater (Brealt, 2011).
Outline Introduction Water quality • Nutrients/gas • Bacteria Toxins • PCBs • Metal What do we know? Water quality • Nutrients/gas • Bacteria Toxins • PCBs • Metal What do we need to find out? Water quality • Nutrients/gas • Bacteria Toxins • PCBs • Metal
Future directions • The Neponset Estuary is very neglected compared to its river. There is only one sampling site in the estuary, so water quality data is virtually non-existent. Nitrogen is most likely the limiting nutrient in this system, so we need to know how much nitrogen and subsequent primary production is in the estuary. • This will allow us to determine whether nitrate concentrations in the watershed are contributing to eutrophication in the estuary itself. Knowing DO levels will be helpful too, because it will tell us if eutrophication-induced hypoxia or anoxia is occurring.
Future directions continued • Stations could be set up around the estuary perimeter as well as across the estuary itself along several gradients and depths to ensure that all variations are captured. There are plenty of boaters in Neponset. If we can get volunteers to measure water quality along the river, we can probably get some for the estuary as well.
References • Breault, R.F., 2011, Concentrations, loads, and sources of polychlorinated biphenyls, Neponset River and Neponset River Estuary, eastern Massachusetts: U.S. Geological Survey Scientific Investigations Report 2011–5004, 143 p • Cosper, E.M. et al. 1987. Recurrent and persistent brown tide blooms perturb coastal marine ecosystem. Estuaries and Coasts10: 284-290. • Herbert, R.A. 1999. Nitrogen cycling in coastal marine ecosystems. FEMS Microbiology Reviews23: 563-590. • Huang, W, and R. Chen. 2009. Sources and transformations of CDOM in the Neponset River watershed. Journal of Geophysical Research114. • Perry, S.L. 2009. More Than One River: Local, Place-Based Knowledge and the Political Ecology of Restoration and Remediation Along the Lower Neponset River, Massachusetts. UMass Amherst Dissertations and Theses. • Vitousek, P.M. et al. 1997. Human alteration of the global nitrogen cycle: sources and consequences. Ecological Applications7: 737-750. • Total maximum daily loads of bacteria for Neponset river basin. Mass. Dept. of Environmental Protection. http://www.mass.gov/dep/water/resources/neponset.pdf • Neponset river subwatershed river and estuary segment assessments. Boston Harbor Watershed 1999 Water Quality Assessment Report