Download
1 / 28
310 likes | 518 Views
21. The Euro. Prepared by: Fernando Quijano Dickinson State University. In 1961 the economist Robert Mundell wrote a paper discussing the idea of a currency area, also known as a currency union or monetary union, in which nations replace their national monies with a common currency.

E N D
21 The Euro Prepared by:Fernando Quijano Dickinson State University
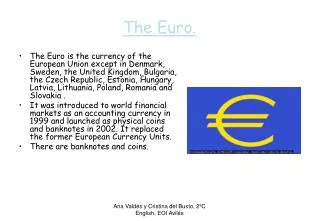
In 1961 the economist Robert Mundell wrote a paper discussing the idea of a currency area, also known as a currency union or monetary union, in which nations replace their national monies with a common currency. Almost forty years later, in 1999, 11 nations in Europe elected to form such a currency area, known as the Euro area, or Eurozone. Later that year, Mundell received the Nobel Prize. By 2011 there will be 17 member countries. They will all use the new notes and coins bearing the name euro and the symbol €.
The main impetus for the euro project came in 1992 with the signing of the Treaty on European Union, at Maastricht, in the Netherlands. Under the Maastricht Treaty, the EU initiated a grand project of Economic and Monetary Union (EMU). A major goal of EMU was the establishment of a currency union in the EU whose monetary affairs would be managed cooperatively by members through a new European Central Bank (ECB). Those who wish to get “in” must first peg their exchange rates to the euro in a system known as the Exchange Rate Mechanism (ERM).
FIGURE 21-1 EU à la Carte This map shows the state of Europe as of 2013, indicating members in the EU, the Eurozone, and the ERM and potential future members. Notes: EU-Eurozone (17): Austria, Belgium, Cyprus, Estonia, Finland, France, Germany, Greece, Ireland, Italy, Luxembourg, Malta, Netherlands, Portugal, Slovakia, Slovenia, Spain EU-ERM (3): Denmark, Lithuania, Latvia EU-Other (8): Bulgaria, Czech Republic, Hungary, Poland, Romania, Sweden, United Kingdom, Croatia Candidates (3): Iceland, Macedonia, Turkey
The Long Road to Maastricht and to the Euro On 13 July 2010 the Council of the European Union approved Estonia’s request to join the euro area on 1 January 2011. Estonia duly joined the euro area on that date and the euro replaced the kroon at a fixed conversion rate of €1 = EEK 15.6466. There will be a two-week period when both currencies are in circulation, with change normally provided in euro. Latvia will join 1 January 2014
The Maastricht Treaty • A firm commitment to launch the single currency by January 1999 at the latest. • A list of five criteria for admission to the monetary union. • A precise specification of central banking institutions. • Additional conditions mentioned (e.g. the excessive deficit procedure).
The Maastricht Convergence Criteria • Inflation: • not to exceed by more than 1.5 per cent the average of the three lowest inflation rates among EU countries. • Long-term interest rate: • not to exceed by more than 2 per cent the average interest rate in the three lowest inflation countries. • ERM membership: • at least two years in ERM without being forced to devalue. • Budget deficit: • deficit less than 3 per cent of GDP. • Public debt: • debt less than 60 per cent of GDP: • Note: Observed on 1997 performance for decision in 1998.
Inflation Convergence To meet the Maastricht Treaty’s convergence criteria, the first 12 members of the Eurozone had to reduce their inflation level below a moving target. This target was equal to average inflation in the three lowest-inflation countries in the bloc plus 1.5 percentage points. This process ensured that the Eurozone began with a low inflation rate. The countries currently in the ERM must pass the same test before they can adopt the euro.
Breaking of Fiscal Rules The fiscal convergence criteria laid down by the Maastricht Treaty and affirmed by the Stability and Growth Pact have been widely ignored. This figure shows the number of times that each of the original 12 members of the Eurozone have violated the 3% of GDP government deficit limit since joining the Eurozone.
The Theory of Optimum Currency Areas 1 The Economics of the Euro • If countries make a decision that best serves their self-interest—that is, an optimizing decision—when they form a currency union, then economists use the term optimum currency area (OCA) to refer to the resulting monetary union. • To decide whether joining the currency union serves its economic interests, a country must evaluate whether the benefits outweigh the costs.
The Theory of Optimum Currency Areas Market Integration and Efficiency Benefits If there is a greater degree of economic integration between the home region (A) and the other parts of the common currency zone (B), the volume of transactions between the two and the economic benefits of adopting a common currency due to lowered transaction costs and reduced uncertainty will both be larger. Economic Symmetry and Stability Costs If a home country and its potential currency union partners are more economically similar or “symmetric” (they face more symmetric shocks and fewer asymmetric shocks), then it is less costly for the home country to join the currency union.
The Theory of Optimum Currency Areas The net benefits of adopting a common currency equal the benefits minus the costs. The two main lessons we have just encountered suggest the following: ■As market integration rises, the efficiency benefits of a common currency increase. ■As symmetry rises, the stability costs of a common currency decrease.
FIGURE 21-2 Stylized OCA Criteria Two regions are considering a currency union. If markets become more integrated (a move right on the horizontal axis), the net economic benefits of a currency union increase. If the economic shocks they experience become more symmetric (a move up the vertical axis), the net economic benefits of a currency union also increase. If the parts of the region move far enough up or to the right, benefits exceed costs, net benefits are positive, and they cross the OCA threshold. In the shaded region above the line, it is optimal for the parts of the region to form a currency union. In practice, the OCA line is likely to be above and to the right of the FIX line.
What’s the Difference between a Fix and a Currency Union? • When countries consider forming a currency union, the economic tests (based on symmetry and integration) set a higher bar than they set for judging whether it is optimal to fix. • For example, Denmark is in the ERM, so the krone is pegged to the euro, but not in the Eurozone. Denmark appears to have ceded monetary autonomy to the ECB, but transactions between Denmark and the Eurozone still require a change of currency. • By keeping its own currency, Denmark has the option to exercise monetary autonomy or leave the ERM at some future date if they want the flexibility of a more freely floating exchange rate.
Other Optimum Currency Area Criteria Labor Market Integration In the event of an asymmetric shock, labor market integration provides an alternative adjustment mechanism. With an excess supply of labor in one region, adjustment can occur through migration (see Figure 21-3). Fiscal Transfers If fiscal policy is not independent but built on top of a federal political structure with fiscal mechanisms that permit interstate transfers—a system known as fiscal federalism, then a third adjustment channel is available. If Home suffers a negative shock, fiscal transfers from Foreign allow more expansionary fiscal policy in Home. If fiscal transfers result in gains for Home, there is a shift down from OCA1 to OCA2 in Figure 21-3.
Other Optimum Currency Area Criteria FIGURE 21-3 Changes in Other OCA Criteria Several other criteria can make a currency union more attractive, even for given levels of market integration. Factors that lower costs or raise benefits will shift the OCA line down and to the left, expanding the OCA zone.
Monetary Policy and Nominal Anchoring If Home suffers from chronic high inflation that results from an inflation bias of Home policy, the more politically independent common central bank of the currency union could resist political pressures to use expansionary monetary policy for short-term gains. Italy, Greece, and Portugal are Eurozone members that historically have been subject to high inflation. High-inflation countries are more likely to want to join the currency union the larger are the monetary policy gains of this sort.
Political Objectives Finally, there is the possibility that countries will join a currency union even if it makes no pure economic sense for them to do so. Forming a currency union has value for political, security, strategic, or other reasons. Political benefits can be represented in Figure 21-3 by the OCA line shifting down from OCA1 to OCA2. In this scenario, for countries between OCA1 and OCA2, there are economic costs to forming a currency union, but these are outweighed by the political benefits.
Optimum Currency Areas: Europe versus the United States APPLICATION We can use comparative analysis to see if Europe performs as well as or better than the United States (viewed as a common currency zone) on each of the OCA criteria, which would lend indirect support to the economic logic of the euro. Goods Market Integration within the EU As intra-EU trade flows rise further, the EU’s internal market will become more integrated, but on this test Europe is probably behind the United States (see panel (a) of Figure 21-4). Symmetry of Shocks within the EU Most EU countries compare quite favorably with the U.S. states on this test. There is no strong consensus that EU countries are more exposed to local shocks than the regions of the United States (see panel (b) of Figure 21-4).
Optimum Currency Areas: Europe versus the United States APPLICATION FIGURE 21-4 (1 of 3) OCA Criteria for Europe and the United States Most economists believe that the United States is much more likely to satisfy the OCA criteria than the EU is. Why? Data in panel (a) show that interregional trade in the United States rises to levels much higher than those seen among EU countries.
Optimum Currency Areas: Europe versus the United States APPLICATION FIGURE 21-4 (2 of 3) OCA Criteria for Europe and the United States (continued) Data in panel (b) show that U.S. and EU shocks are comparably symmetric.
Optimum Currency Areas: Europe versus the United States APPLICATION FIGURE 21-4 (3 of 3) OCA Criteria for Europe and the United States (continued) Data in panel (c) show that U.S. labor markets are very integrated compared with those of the EU.
Optimum Currency Areas: Europe versus the United States APPLICATION Labor Mobility within the EU Labor in Europe is much less mobile between states than it is in the United States. The flow of people between regions is also larger in the United States than in the EU. Labor markets in Europe are generally less flexible, and differences in unemployment across EU regions tend to be larger and more persistent than they are across the individual states of the United States. In short, the labor market adjustment mechanism is weaker in Europe. On this test, Europe is far behind the United States. Fiscal Transfers Stabilizing transfers, whereby substantial taxing and spending authority are given to the central authority, exist in the United but not in the EU.
Optimum Currency Areas: Europe versus the United States SummaryOn the simple OCA criteria, the EU falls short of the United States as a successful optimum currency area, as shown in Figure 21-5. Goods market integration is a little bit weaker, fiscal transfers are negligible, and labor mobility is very low. At best, economic shocks in the EU are fairly symmetric, but this fact alone gives only limited support for a currency union given the shortcomings in other areas. Most economists think there are still costs involved when a country sacrifices monetary autonomy. On balance, economists tend to believe that the EU, and the current Eurozone within it, were not an optimum currency area in the 1990s and that nothing much has happened yet to alter that judgment. ■ APPLICATION
Optimum Currency Areas: Europe versus the United States APPLICATION FIGURE 21-5 Stylized OCA View of the EU and the United States Most economists consider that the Eurozone and EU countries do not satisfy the OCA criteria—they have too little market integration and their shocks are too asymmetric. The Eurozone may be closer to the OCA line since integration runs deeper there, but it is still far behind the United States on the OCA criteria. If we expand to the EU of 27, it is likely that this larger zone fails to meet OCA criteria by an even larger margin, with lower integration and higher asymmetry than the current Eurozone.
Are the OCA Criteria Self-Fulfilling? Some economists argue that by adopting a common currency, it might become an OCA in the future. Joining a currency union might promote more trade, by lowering transaction costs. If the OCA criteria were applied ex ante (before the currency union forms), then many countries might exhibit low trade volumes. It might be the case that ex post (after the currency union is up and running) countries would trade so much more that in the end the OCA criteria would indeed be satisfied.
Optimum Currency Areas: Europe versus the United States APPLICATION FIGURE 21-6 (1 of 2) Self-Fulfilling OCA Criteria Euro-optimists believe that the OCA criteria can be self-fulfilling. Suppose the Eurozone is initially at point 1, but then the effects of EMU start to be felt. Eventually, there will be an increase in market integration (more trade, capital flows, migration), moving the zone to point 2. There may also be a greater synchronization of shocks in the Eurozone, moving the zone to point 3.
Optimum Currency Areas: Europe versus the United States APPLICATION FIGURE 21-6 (2 of 2) Self-Fulfilling OCA Criteria (continued) However, euro-pessimists note that market integration and more trade might also lead to more specialization by each country in the EU. In that case, the shocks to each country are likely to become more asymmetric, implying a move toward point 4 or point 5. In the case of point 5, the case for an OCA grows weaker, not stronger, after the long-run effects of the currency union have been worked out.