Download
1 / 24
240 likes | 392 Views
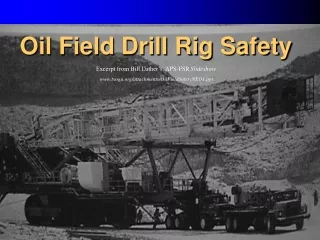
ADVANCES IN DRILL RIG DEPLOYED RADARS. Mr Tim Sindle , ARCO/CRC Mining Imaging Lab, The University of Sydney Dr Carina Kemp, Business Development Manager, GEOMOLE. 11 th SAGA Biennial Conference and Exhibition, 16-18 September 2009. Outline. Introduction Method and Results

E N D
SAGA, September 2009 ADVANCES IN DRILL RIG DEPLOYED RADARS • Mr Tim Sindle, ARCO/CRC Mining Imaging Lab, The University of Sydney Dr Carina Kemp, Business Development Manager, GEOMOLE 11th SAGA Biennial Conference and Exhibition, 16-18 September 2009
Outline • Introduction • Method and Results • Survey Gear Minimisation • Analyzing Drill Deployed Data • Automatic Algorithm Development • Conclusions SAGA, September 2009
Introduction – In-mine geophysics The Good The Bad • Anticipate problems ahead of mining • Improve efficiency of mining operations • Bulky gear • Time consuming surveys cause delays in production No matter how good the results, if any technique cannot be easily and reliably implemented in the mining environment, it will not be used mainstream. SAGA, September 2009
Introduction – Borehole Radar (BHR)? • Ground penetrating radar (GPR) in a drillhole • Reflections indicate a contrast in the electrical properties of the rock. • BHR provides high detailed continuous reflections from lithology contacts and structures. GeoMole BHR • 10 – 124 MHz Bandwidth • Resolution: less than1m • Range: up to 50m or more (depending on rock type) • Probe diameter: 32 mm • BHR Profiling at ~10 m/min • Omnidirectional antenna SAGA, September 2009
BHR then…. • Survey trials of BHR showed very promising results, but the gear let us down. • 50 kg optical fibre winch • 20 kg push rods • 10 kg probes SAGA, September 2009
BHR Now - Minimal Gear • Radar Tool • 1.6m • 3kg • Non-conductive spacers • 1.5m • 2kg each • Drill attachment • PDA PDA + + IQ Drill Attachment Radar Spacers SAGA, September 2009
BHR Now – Drill rig deployed drill bit spacers Core barrel IQ SAGA, September 2009
Drill Rig Deployed Borehole Radar - Pumpdown The radar tool continuously records data. The motion of the rods is discontinuous as the rods pulled and removed. Spacers Radar Tool
Deployment Motion… OTR Survey Winch Survey Moving Moving Measurement (station) Measurement (Stationary) Stationary Depth Depth
Radar Data… Winch Survey OTR Survey Stationary Moving Same 40m section of a horizontal borehole
Raw Data • Aim: To understand the motion in order to work out how to recompress it. • Different motion for each type of drill-rig Boart LM75 Diamond SAGA, September 2009
Raw Data Recompressed Data Recompressing Radar Data..
Movement Log • Logging procedure tracks accurately the motion of the drill rig. • User records ‘MOVE’, ‘STOP’ and ‘ROD-CHANGE’ following the motion of the drill. • These events are time stamped and recorded for data processing Accelerometers were installed in the radars to assist with movement logging SAGA, September 2009
Time Log processed Data • Vulnerable to human error SAGA, September 2009
Automatic Algorithm Development Using the accelerometer data for automatic processing: • Statistical deviation measurement • Fourier Spectrum Analysis • Velocity integration calculations SAGA, September 2009
Statistical Processed Data Standard Deviation Threshold Amplitude Traces SAGA, September 2009
Accelerometer Processed Data • Suffers from random accelerometer events SAGA, September 2009
Fourier Spectrum Analysis • Examine the power in various regions of motion • Difference observed between some moving and stopped traces by examining the higher frequency content. • However, drill vibrations cause wide band energy gains. • METHOD ABANDONED Frequency Spectrum Stopped with drill shock Start of move Stopped Constant velocity move * SAGA, September 2009
Velocity Processed Data • Noisy environment causes spurious accelerations and accurate velocity is hard to gather. • A high pass filter distributes the velocities aroundzero. • Then the mean representation of the velocity is calculated Amplitude Positive = Moving, Negative = Stopped Trace SAGA, September 2009
Velocity Processed Data • Copes well with the sharp drill shocks and vibrations as they often have equal positive and negative direction. • Captures the start and stop of the movement well. • Particularly violent jerks can cause a trace to be lost. SAGA, September 2009
Comparison… Accelerometer Raw Data Time Log Velocity SAGA, September 2009
Conclusions… • Drill deployed radars can be run with minimal disruption to normal work flow. • Using the time log alone can be vulnerable to human error • Yet all automated methods investigated so far are vulnerable to sharp spurious drill movements. • A combination of a time log together with statistical and velocity methods will result in smooth “winch quality” images being produced. • Development in this area continues SAGA, September 2009
Conclusions • The ultimate aim of a tool knowing its own position automatically is theoretically possible, but only within well defined constraints, and there will always be the unknown events on the drill rig that can cause inaccuracies. • The above progress makes it possible for quick data turnaround from survey to seamless integration of BHR data into mine planning packages, to enable day to day mining decisions to be made using such tools. SAGA, September 2009
Acknowledgements… • The authors would like to thank DeBeers Canada in particular Kevin Smith, for their ongoing feedback and use of the tool. • The funding contributions of ARCO, CRC Mining, and GeoMole are gratefully acknowledged. • Many thanks to the tireless work by Sydney University ARCO Lab members including; Andrew Bray, Steven Owens, and Phillip Manning. SAGA, September 2009