Download
1 / 28
280 likes | 534 Views
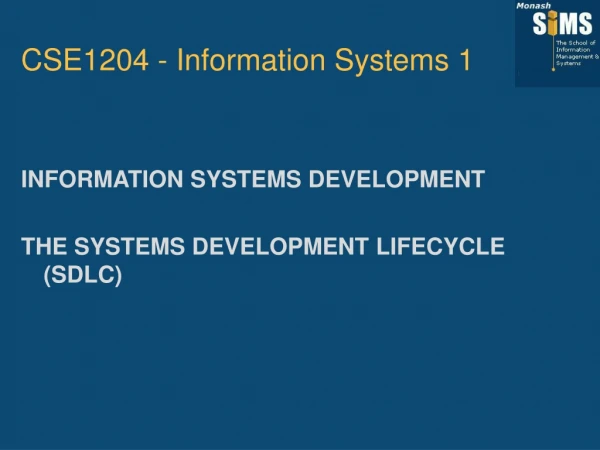
CSE1204 - Information Systems 1. Data Flow Diagrams Levelling Them; Process Modelling Using Function Decomposition. Levelling of DFDs. Context. Level 0. 1. 2. 3. 4. 1.3. 4.2. Level 1. 1.1. 1.2. 2.1. 2.2. 3.1. 3.2. 4.1. 4.3. Level 2. 1.1.1. 1.1.2. 3.2.1. 3.2.2.

E N D
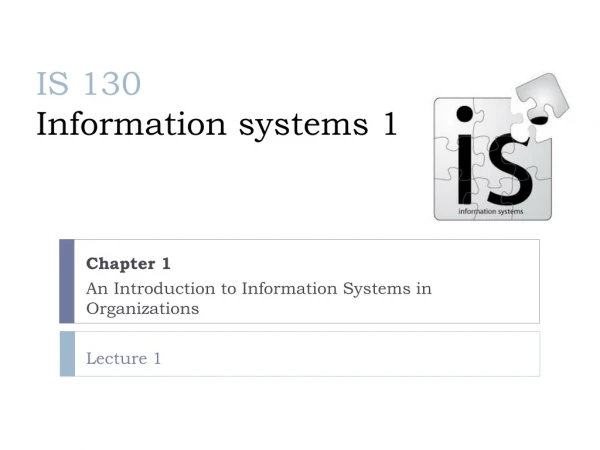
CSE1204 - Information Systems 1 Data Flow Diagrams Levelling Them; Process Modelling Using Function Decomposition
Levelling of DFDs Context Level 0 1 2 3 4 1.3 4.2 Level 1 1.1 1.2 2.1 2.2 3.1 3.2 4.1 4.3 Level 2 1.1.1 1.1.2 3.2.1 3.2.2
Guidelines for Levelling DFDs External communication: • external agents represent entities in the environment of our information system • external agents are outside the scope of our information system • we do NOT model interactions between external agents • we do NOT allow external agents to interact directly with data stores
Guidelines for Levelling DFDs • numbering: when a process is decomposed, its diagram is given the same number as that process • balancing of levelled DFDs: all data flows entering and leaving a process must appear on the corresponding diagram which decomposes that process • external agents: are only included on the two diagrams which represent the entire system, i.e. the context and level zero diagrams
Guidelines for Levelling DFDs • the access to data stores across levels of diagrams must be consistent: • the direction of accesses must match and all accesses on higher level diagrams must appear on corresponding lower level diagrams • a data store is first shown on the highest level diagram where it is accessed by more than one process • it can then appear on all lower level diagrams where it is accessed
Guidelines for Levelling DFDs the access to data stores across levels of diagrams must be consistent: 1 1.2 1.1 1.3 2
Guidelines for Levelling DFDs How many levels should be in a set of DFDs? • each diagram usually has between 3 and 7 processes • level the diagrams until bottom level or primitive processes are reached: primitive processeshave only 1 or 2 inputs and outputs, and cannot be further decomposed as a data flow diagram
Guidelines for Levelling DFDs • partition processes to minimise the data flows between them • partition processes to form cohesive, related groups of activities • not all parts of the system may need to be decomposed to the same level
An example - Context Diagram Line Manager Applicant Address Position Spec Applicant name Position Acknow- ledgement Employment System Successful Applicant • Payroll System Decision Position
An example - Level zero diagram Applicant Applicant name Line Manager Position Address Ackn’d Appn Position Spec 1 Accept Applic- ation Decision 2 Acknow- ledgement Evaluate Applicants Applicant Position Unsuccessfuls file Evaluation results Payroll System Successful Applicant
Level 1- Diagram 1 Address Applicant name Position Acknow- ledgement Verified Application 1.1 1.2 Verify for Complete- ness Acknow- ledge Application Acknowledged Application
Level 1 - Diagram 2 Ackn’d Appn Position Spec Qualified applicant 2.1 unqualified applicant Screen Applicants Decision 2.2 2.3 Reject Unsuitables Schedule Evaluation Decision Successful Applicant Unsuccessfuls file Evaluation results
Logical and physical DFDs Models may focus on either: • the “physical” view of the real world – how things are done OR • the “logical” view of the real world – what things are done
Physical DFDs • represent a particular way of implementing the processes and data in a system • they are technology dependent – they specify particular methods of doing tasks • they show how the processing takes place and how the data is implemented
Logical DFDs • represent what a system must do regardless of how it is implemented • they are technology independent • they show what processing, data movements and data storage must occur in a system • they show the essentialaspects of a system
Using Logical and Physical DFDs • Physical DFDs modelling current system: help systems analysts become familiar with how a business or system operates • Physical DFDs modelling new systems: model the technical and human design decisions to be implemented • users can relate to physical DFDs more readily because • they contain implementation details: • landmarks e.g. people or roles, actual locations
Use of Logical and Physical DFDs • Systems analysts often begin with physical DFDs of current systems: • convert that physical DFD to a logical model in order to focus on essential elements • use the logical model to model a new logical solution (DFD) • Convert the logical solution into a physical DFD (implementation) model • implementation details can be removed from physical DFDs
Physical to Logical DFDs • use names for data flows and data stores which indicate their content, not their physical form or location • use names for processes that indicate what, not how
Physical to Logical DFDs checked AZ104 form 2.1 AZ104 form Bill checks form Master File valid sales order 2.1 sales order Validate sales order Sales orders
Logical and Physical DFDs Physical DFDsLogical DFDs View How processing is implemented What the system does Processes Actual sequence Essential sequence Naming Forms, locations, people/roles Underlying data and activities Data flows Detailed/ specific/ duplicated Only essential inputs and data describing exact outputs of the processes implementation needs
Function Decomposition: a Process Modelling Technique • function decomposition is the decomposing of a system into its component functions and processes as a way of managing complexity • function decomposition creates a top-down view: it shows a hierarchy of levels of increasingly detailed processes within a system • a function decomposition model (or diagram) is used to represent the hierarchical decomposition and structure of the processes of a system • the decomposition of functions corresponds to levelling of processes in DFDs
Function Decomposition Diagrams • a function is a high-level set of related activities that are ongoing: a function is a broad, generic activity • a process is a lower level activity that is repeatedly carried out • functions consist of groups of related processes • the depth and scope of function decomposition diagrams depend on the size and complexity of the system represented
Function Decomposition Diagrams • function decomposition diagrams showing only higher levels can be built early in systems analysis • more detailed process decomposition can be carried out as the system is studied in more detail • function decomposition diagrams show the structure of functions and processes within the system • this structure may not correspond to the structure of the organisation shown in an organisation chart See Whitten et al (2001) p 5, p 338 for examples
Function Decomposition Diagrams • each function and process should have a unique name which indicates what it does ABC Sales System 1. Sell Products 2. Manage Inventory 3. Control Finance a top level function decomposition diagram
Example Function Decomposition Diagram ABC Sales System 1. Sell Products 2. Manage Inventory 3. Control Finance 2.1 Deliver Product 2.2 Accept Delivery 2.3 Check Stock levels functions and processes are further decomposed
Function Decomposition the decomposition of functions and processes corresponds to the levelling of DFDs 3.0 1.0 2.0 1.1 1.2 1.2.1 1.2.2
Function Decomposition • function decomposition diagrams are an alternative representation of the hierarchy of functions and processes within a system • they may be built using either a top down or a bottom up approach • they provide a useful overview of the processing within a system
References • WHITTEN, J.L., BENTLEY, L.D. and DITTMAN, K.C. (2001) 5th ed., Systems Analysis and Design Methods, Irwin/McGraw-HilI, New York, NY. Chapters 8 • HOFFER, J.A., GEORGE, J.F. and VALACICH (2005) 4th ed., Modern Systems Analysis and Design, Benjamin/Cummings, Massachusetts. Chapter 7